2018 Participatory Science Annual Report
Participatory Science is special because volunteer efforts help to produce new knowledge and discoveries. However, usually, our volunteers only get to see a tiny slice of the research that they are contributing to. So, we think that it is important to show you the results of your efforts. We could not have done any of this work without you!
During the 2018, all but one of SERC's labs worked with volunteer scientists. More than 600 volunteers contributed nearly 15,000 hours to SERC's research programs. When we count volunteers who helped online and students who helped in classrooms, there were more than 2,500 participants in SERC's Participatory Science program this year. Thank you to all our volunteer scientists who contributed to our projects this past year! You help us to do more and better science than we could on our own. We also really just like having you around.
We are excited to share some of the results of our Participatory Science projects from the last year. Check out what we were up to, by clicking on a project to learn more about it:
Topic |
Project Name |
| Environmental Chemistry | The Salt Marsh Plant Census |
| History | Archaeology (volunteer run) |
| Marine and Estuarine Ecology |
Marine Ecology |
| Marine Invasions | The Chesapeake Bay Parasite Project Invader ID Nearshore Sampling Oyster Drills Plate Watch |
| Terrestrial Ecology |
Bluebirds (Volunteer run) |
| Education and Outreach |

THE SALT MARSH PLANT CENSUS

Volunteer scientists counting and measuring plants as part of the annual census.

Volunteer scientists counting and measuring plants as part of the annual census.

SERCs Kirkpatrick marsh has had experiments running for the past 30 years!


Wetlands are one of nature’s most valuable resources. Wetlands improve water quality and reduce nutrient runoff. They reduce flood damage by soaking up water like sponges, storing floodwater and releasing it slowly. Wetlands mitigate hurricane damage by absorbing wave energy. They also serve as nurseries and provide critical habitat for wildlife.
For over 30 years, the Global Change Research Wetland (GCReW) research team has studied how SERC’s coastal marshes respond to environmental change. Each year, volunteer scientists help collect data about the plants and their reactions to changes, like increased levels of carbon dioxide and nitrogen, introduction of invasive species, and rising temperatures.

One of GCReW’s newest experiments, SMARTX (Salt Marsh Accretion Response to Temperature Experiment), studies the effect of increasing temperature on marsh plants. Heat coils in the soil and heat lamps above the plants raise the temperature to simulate temperature increases expected over next century due to climate change. The temperature is raised by approximately 2, 3, or 5o C. Control plots, where the temperature is not changed, are used to see how plants grow without any temperature change. Each summer researchers, with the help of volunteer scientists, measures the height and width of the marsh plants as they grow. This requires an enormous amount of effort and dedicated volunteers have been essential in collecting this huge amount of data. The results from the last two years show that the higher the temperature, the more the plants grew. Additionally, this year plants from all temperatures grew more overall than they had in 2017. Researchers think all of the rain in 2018 may explain this change. Marsh plants live in brackish water, a mixture between fresh and salty water. Salt puts stress on marsh plants, but they can tolerate it and still grow. However, 2018 was a really rainy year. Researchers think that the amount of rain in 2018 decreased the saltiness of the water, so the plants weren’t as stressed and could put more energy into growth.
While continuing to monitor the current study, researchers will begin to look at warming in combination with increased carbon dioxide and nitrogen, to understand the impact of multiple aspects of climate change on the marsh. Stay tuned for those results!
![]()
ARCHAEOLOGY

Oyster Work – Volunteer scientists Leo Plourde and Katie Cannon discussing their data.

Measuring the length of an oyster shell.

A sample of oyster shells after cleaning.


People lived on the land that is now the SERC campus for hundreds of years. Our Environmental Archaeology Lab digs up, cleans, and catalogs artifacts that these people left behind. These objects help us understand how people used and changed the land through time. The lab is run entirely by volunteer scientists, and we are grateful for their dedication and hard work.
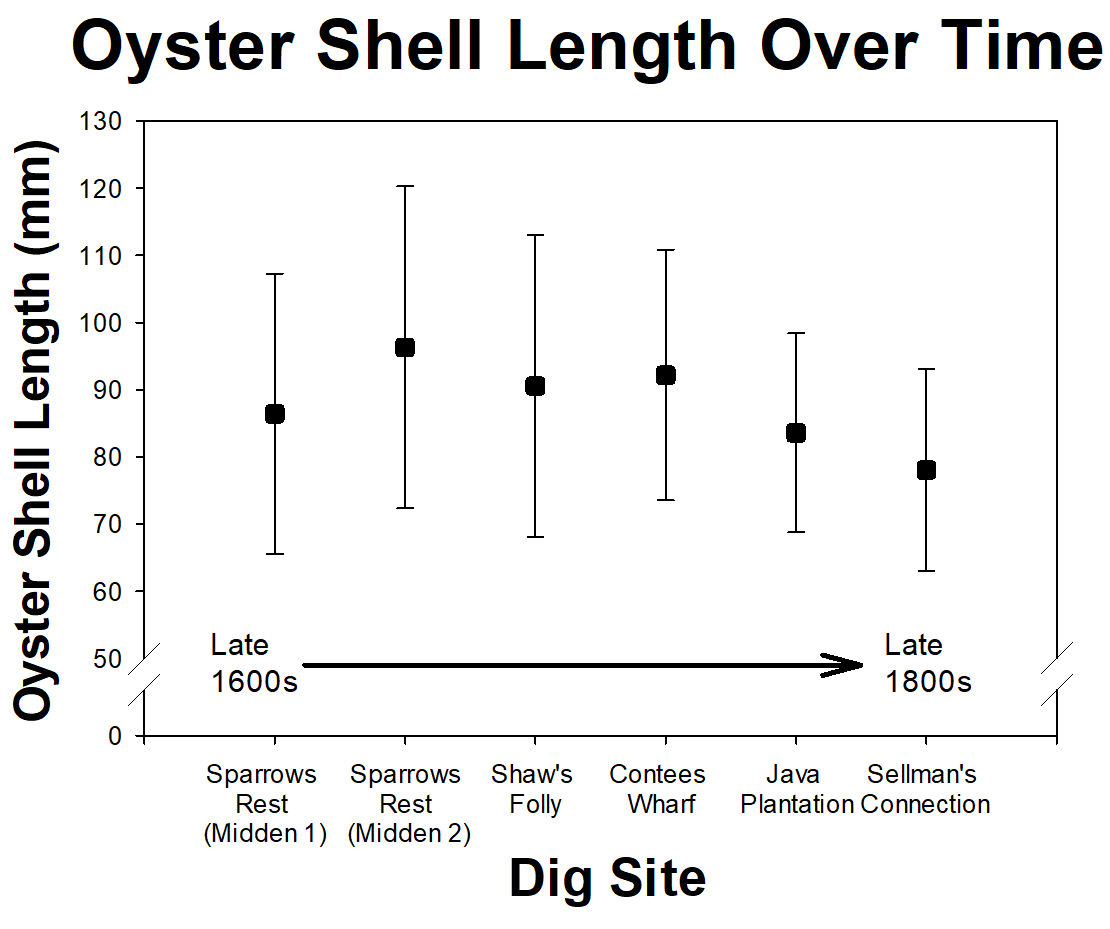
Not only do our volunteer scientists help with daily tasks, such as sieving sediments and washing artifacts, they also contribute to analyses and even develop their own research projects. This year, a group of our volunteer scientists examined oyster shells from kitchen middens, or trash heaps. Of the six sites, three were from 17th century (late 1600s) plantation, one from a 19th century (early 1800s) plantation, and two from early and mid 19th century slave quarter sites. The volunteer scientists looked at oyster shells from each location to see how they changed through time. All the sites were within half a mile of each other and the oyster shells were most likely from the Rhode River, which is the nearest water source. These shell samples provided evidence that they previous owners ate oysters for over the past 250 years. However, there was no significant change in the average shell length through time.
![]()
MARINE ECOLOGY

Ed Ambrogio posing with 6 year old oysters.

Josefa O’Malley collecting an oyster tissue sample.


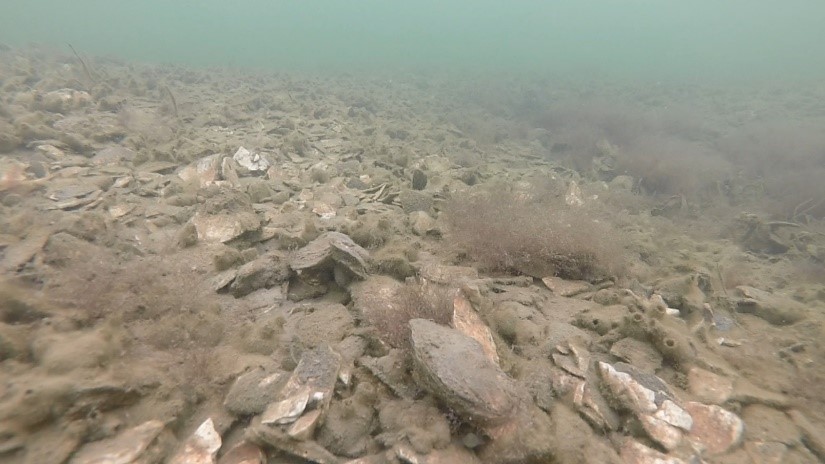
The Marine Ecology Lab is studying parasites that infect bivalves, like oysters and clams, in Chesapeake Bay. Infections by the single-celled pathogen Perkinsus cause dermo disease in oysters and perkinsosis disease in clams. Dermo has been responsible for widespread oyster deaths in Chesapeake Bay. Researchers, with help from volunteer scientists, have been tracking Perkinsus infections in Eastern oysters and Macoma clams from the Rhode River since 2014.
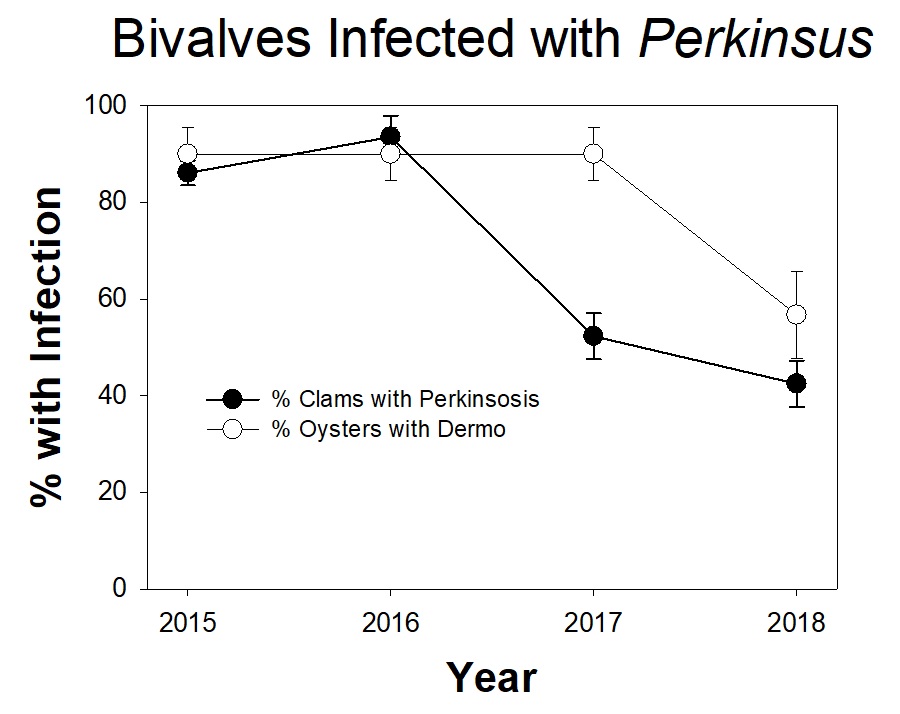
The clams were collected from sediment cores from three sites within the Rhode River. Of the approximately 100 clams examined in 2018, fewer than 45% were infected with Perkinsus. This is similar to the percentage of infected clams from 2017, but much lower than the percentages found in 2015-2016 (over 85% of clams were infected). It is noteworthy that the percent of clams infected was similar in 2017 and 2018, because as you’ll notice throughout the newsletter, all of the rain in 2018 caused unusual responses in many SERC research projects. Preliminary data from oysters at the oyster reef near the SERC dock suggests that fewer of the oysters showed signs of dermo in 2018 than in 2015-2017. However, for the oysters, we collect lots of different kinds oyster samples, so this needs to be combined with other data before we can draw any real conclusions. Studying the different infection patterns between oysters and clams could be an interesting research area in future years.
Beginning in 2019, this research will be led by the Marine Disease Ecology Lab with the goal of collecting a longer and more detailed time series to improve our understanding of disease dynamics in the Bay.
As always a tremendous thank you is extended to volunteers who helped on this project!
![]()
OYSTER GROWTH IN RHODE RIVER

Oyster shell with many baby oysters (spat) attached to it.

Volunteers measuring and counting baby oysters.


Healthy oyster reefs are part of a healthy Chesapeake Bay ecosystem, making the whole Bay more ecologically and economically productive. A healthy adult oyster can filter up to 50 gallons of water a day. As the oysters filter the water, they improve water clarity. Improved water clarity helps underwater plants grow, which provide oxygen and habitat for fish and other creatures. Oyster reefs also create habitat, which provides shelter and spawning areas for a wide range of animals. Unfortunately, the current population of Eastern oysters in Chesapeake Bay is only at about 1% of its historical levels.
Volunteers with the West and Rhode Riverkeeper hang oyster baskets filled with baby oysters on oyster shells from their docks each fall. In the summer, the Riverkeeper places the now young adult oysters in an oyster sanctuary in the South River. However, the Riverkeeper hasn’t ever collected data about the ways that we might be able to help more of the oysters survive or grow larger. SERC’s Participatory Science Program is collaborating with the West and Rhode Riverkeeper and South River High School student, Jack Drohat, to try to figure out the best ways to grow the oysters.
Over the summer, volunteers helped pilot methods for cleaning the oysters and counting and measuring the spat (baby oysters). This information helped us plan for our fall sampling and for ways that the project might work in classrooms.
From the experiment that we started this fall, we hope to identify the optimal amount of oyster shells per oyster basket. We counted and measured the spat, and the baskets are currently hanging from private docks throughout the Rhode River. Some of the baskets have the amount of oyster shells that the Riverkeeper has traditionally used, some have 50% more shells, and some have 50% fewer shells. In January 2019, we will recount and measure the (hopefully bigger) baby oysters. We will use our results to develop best practices for the Riverkeeper and their volunteers, so their time and resources are used most effectively.
![]()
RIVER HERRING AND OYSTER REEF ASSESSMENT

Staff fishing for river herring.

Long term volunteer, Dave Norman, has been helping with oyster reef assessment.


The Fish and Invertebrate Ecology Lab have been studying the movement of river herring in the Chesapeake Bay for the last six years. River herring spend most of their lives in the ocean but swim into freshwater streams to spawn. Historically, there were large river herring fisheries, but populations crashed in the late 20th century due to manmade dams that blocked their spawning habitats, overfishing, and other causes. Today, there are ongoing efforts to remove many of these dams, which will provide more spawning habitat for river herring.
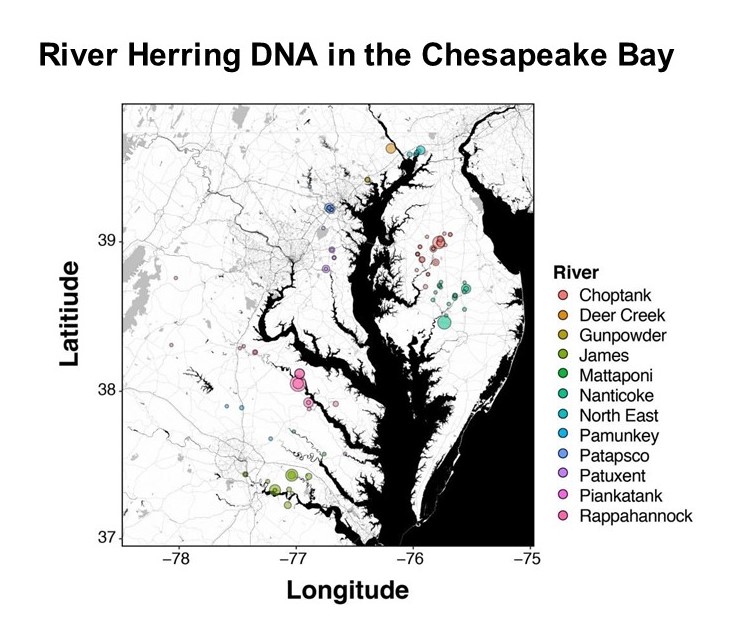
With the help of volunteer scientists, researchers travel to stream sites to observe if the fish are present or absent. They also collect water samples to analyze back in the lab for fish eggs and larvae. These methods are great for seeing which sites river herring are using, but they cannot tell us which of the two species of river herring, alewife or blueback, are spawning there. Over the past couple of years, our researchers have been collecting a second water sample to analyze Environmental DNA (eDNA). eDNA is DNA that an organism releases into the environment as it moves. This year our researchers showed that eDNA is an effective method to determine river herring presence, and have discovered differences in the use of spawning habitats among species that we weren’t able to observe before. The eDNA data showed the same patterns that they had seen with the egg samples and visual observations. If you want to learn more, check out the lab’s new publication.


Reefs scores were based on the numbers of oyster present and the vertical structure that the oysters created. Higher scores indicate higher quality oyster reef habitat, which can support a higher number and increased diversity of organisms.
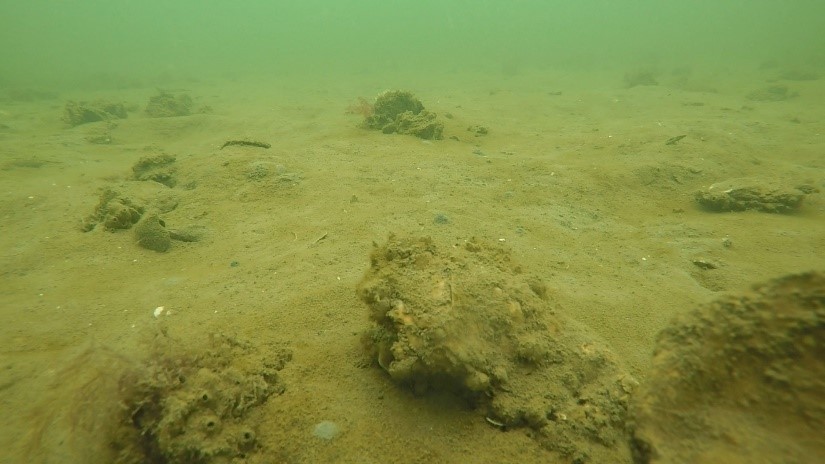
In addition to river herring news, one of the lab’s long time volunteers, Dave Norman, spent his time working on an independent project. He analyzed underwater images of oyster reefs in the Choptank River to assess the quality of natural and manmade oyster reefs. Each site was assigned a habitat score ranging 0 to 3. Reef quality was based on the number of oysters present and the physical height of the reef. Higher quality habitat can house a higher number and greater diversity of organisms. Dave found that areas with restored reefs and natural reefs in oyster sanctuaries had higher reef quality scores. This is one of several lines of evidence showing that oyster reef restoration and oyster sanctuaries can create high quality oyster reef habitat. The Harris Creek oyster restoration project, completed in 2015, had the highest percentage of high quality oyster reef of all of the study sites; 40% of the study sites had a score of 3. Broad Creek, another tributary of the Choptank River, in which oysters are heavily harvested, scored a 3 in only 2% of all study sites.
The Fish and Invertebrate Ecology lab would like to extend a heartfelt thank you to the numerous hours all their volunteer scientists have put in to help us this year!
![]()
THE CHESAPEAKE BAY PARASITE PROJECT

Volunteers collecting mud crabs for analysis.

Intern, Jasmine Mirfattah, sorts, counts, and sets free fish found in the crab collectors.


White-fingered mud crabs are native to the Chesapeake Bay. These small scavengers are commonly found in nearshore habitats, like oyster reefs and woody debris. Mud crabs play an important role in the Bay food web and are prey for many animals. Unfortunately, an invasive, parasitic barnacle called Loxothylacus panopaei (Loxo, for short) is infecting mud crabs. The parasite makes the infected crabs act like zombies! Loxo sterilizes the crab so that it cannot produce any baby crabs and instead carry and care for Loxo larvae. Scientists want to know how Loxo affects the mud crab population, where Loxo are spreading throughout the Bay, and why the number of infected crabs changes from year to year.

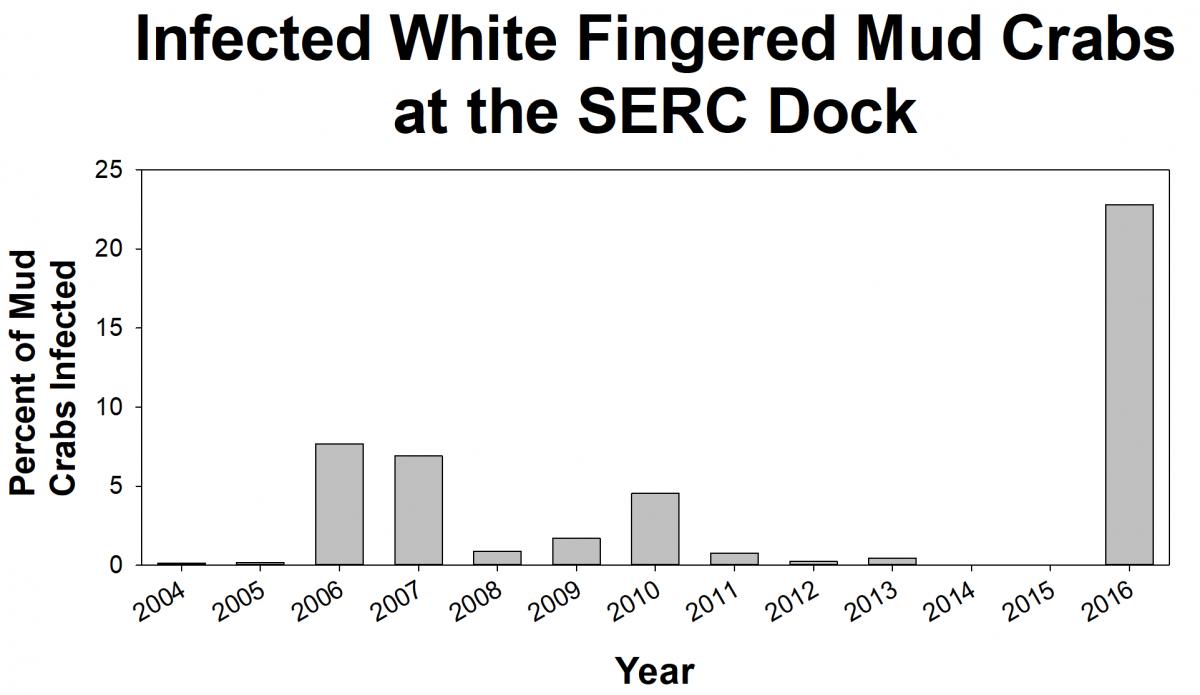
To learn how many crabs are infected, volunteers help SERC scientists from the Marine Invasions Lab sample mud crabs from more than 20 sites in Chesapeake Bay. We have found that the percent of crabs infected with Loxo can change a lot from year to year. In some years, we’ll find no crabs infected with Loxo at a site, but in the next year, lots of the crabs may be infected. For example, at the SERC dock in the summer of 2015, we didn’t find any infected crabs, but a year later, 22% of the crabs were infected. We don’t know what causes these big swings. We are trying to identify environmental conditions that could indicate when outbreaks are likely to occur.
Nearly all of the thousands of crabs we collect each year are found by volunteers. We now have data that says that you guys are doing an awesome job! On average, volunteers only miss 3.4% of the crabs. And 13% of the time they don’t miss any crabs at all! Most of the time (61%) volunteer scientists miss less than 5% of the crabs. We’ve always believed that we have awesome, diligent, careful volunteers, but it is nice to have the data to prove it!
Check out the 2018 Chesapeake Bay Parasite Project Newsletter for more information.
![]()
INVADER ID

Fouling bryozoan under the microscope.

Participants help identify fouling organisms using an online platform.


Since its launch in March 2018, the Marine Invasion Lab's new online Participatory Science project, Invader ID, has had nearly 1,600 volunteers! They have been identifying the marine invertebrates from San Francisco Bay. Researchers hang tiles off docks and suspend them in the water for three months. These tiles are then taken out of the water, photographed, and the photos are uploaded to Invader ID. Through Invader ID, volunteer scientists look at the photographs of fouling organisms, the plants and animals that grow underneath docks. They are helping researchers understand how populations of fouling organisms are changing and to track the spread of invasive species through time.
So far, the volunteer scientists have found lots of solitary tunicates and branching bryozoans. They make up more than half of all of the organisms that have been identified! However, when we break it down by year we see fewer branching bryozoans in 2012 and 2014 than in other years. At this point, we’re not sure if that is a real pattern or not because we’ve identified fewer total animals in 2012 and 2014 than we have from other years. We won’t be able to draw conclusions until more of the data has been analyzed, but it is an interesting pattern to keep an eye on.
In a preliminary data analysis, volunteer identifications agreed with the identifications made by our trained taxonomists 90% of the time! This impressive feat that suggests that volunteer scientists can be a powerful tool to track invasive species.


We also are developing methods that will allow volunteer scientists to hang tiles off their docks, photograph the marine invertebrates, and upload the photos to Invader ID to see what is growing in their own waters! One of our interns, Laura Guiral, created prototypes made of inexpensive, readily available materials to see if we can create a Participatory Science version of the what researchers use. Of the five different prototypes, we found that an auto body dent puller is an easy, cheap, and efficient way to hang tiles. Laura also came up with protocol that would help volunteer scientists take high quality photos of their tiles so that Invader ID volunteers can identify all of the fouling organisms. We’ll be looking for people to try out the prototypes in the spring, so stay tuned!
![]()
OYSTER DRILLS

Predatory oyster drills (snails) on oyster.

Volunteers helping to remove snails from a beach.

Marine Invasions team putting out oysters as part of an experiment.

Volunteers helping to remove invasive snails.


For the past decade, researchers and environmental groups have been working to restore native Olympia oysters in San Francisco Bay. However, an introduced snail, called the Atlantic oyster drill, is complicating restoration projects. These snails feed on the oysters by drilling through the oysters' protective shells. Researchers from the Marine Invasions Lab are conducting experiments to understand the impacts of oyster drills on oyster populations and to see if there are oyster restoration designs that would minimize the impact of the oyster drills.
From previous experiments, researchers knew that at low numbers, the snails don’t impact oyster survival. So, they wanted to test whether removal of oyster drills from locations with lots of snails would help improve oyster survival. Working with volunteers, they found and removed thousands of snails during each of thirteen removal events. In total, they removed more than 31,000 snails from two beaches! To test the impact of the snail removal on oyster survival, researchers and volunteers glued oysters to tiles. Some of the oysters were placed inside cages (which would keep out predators, including oyster drills) and some were uncaged. The caged and uncaged oysters were placed either at a control site, where no snails had been removed, or in an experimental site where researchers and volunteers removed the oyster drills. However, even though they removed all of those snails, there was very low survival of uncaged oysters at both the control and experimental (where snails were removed) sites. Even though 31,000 is a lot of snails, it turned out that this was only a small percentage of the snails on the beaches.
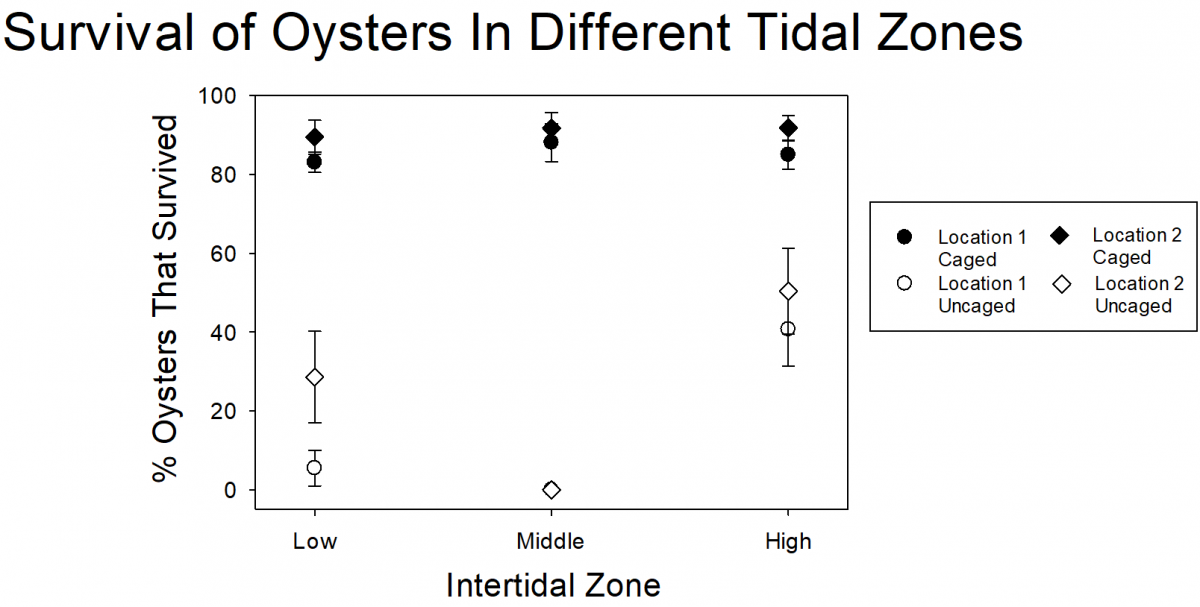
Because it doesn’t seem like snail removal is an effective strategy for helping oysters at these sites (it just isn’t feasible to remove enough of the snails), the researchers wanted to know if there were ways that they could minimize the impact that the snails had. One potential way to reduce the impact of the snails is to put oysters in parts of the intertidal zone where there are few snails. From shoreline surveys, the researchers know that the snails mostly hang out in the middle of the intertidal zone. Researchers and volunteers put caged and uncaged oysters at three levels within the intertidal zone (high intertidal, mid-intertidal, and low intertidal) and left them for one month. They found that 80-90% of caged oysters at all intertidal zone areas survived. Almost all of the uncaged oysters from the mid-intertidal zone and most oysters from the low intertidal zone died. But many (40% or more) of the uncaged oysters in the high intertidal zone survived. In restoration projects, 40% still isn’t great because the majority of the oysters are dying, even in the high intertidal zone, but it does provide some information that can be used for future testing and restoration design.
The researchers are not giving up and are trying to find more solutions to reduce the impact of the oyster drills. They are planning more studies that they hope will improve the success of oyster restoration efforts in San Francisco Bay.
![]()
PLATE WATCH

Colonial tunicate on brick. Photo by Deborah Mercy

Student from Prince William Sound Community College in Alaska helping identify marine invertebrates. Photo by Nellie Vanderburg


The Marine Invasions Lab has been working with volunteer scientists around Ketchikan, Alaska to track the movements of invasive species (learn more about the differences between non-native, introduced, and invasive species here). Specifically, they are looking for invasive species that are part of fouling communities. Fouling communities are groups of organisms (such as sea squirts, bryozoans, and barnacles) that live attached to hard surfaces, including to man-made hard surfaces, like docks and ship hulls. Because fouling communities often live in shallow, coastal areas, they are heavily impacted by human activities. Animals attached to the hulls of boats and ships can move from one place to another, and sometimes, become problematic in new locations.
Plate Watch volunteers track the movement of fouling community organisms by hanging small PVC tiles from docks and piers. They leave the tiles there for three months, giving time for lots of fouling community animals to settle onto the tiles. The volunteer scientists photograph the animals growing on their tiles and stay on the lookout for invasive species. SERC researchers use those photographs to see when new invasive species show up and to learn if they are spreading through an area.
Recently, researchers from SERC, Temple University and the University of Alaska, Fairbanks, published a study that combined data from scientific surveys and Plate Watch observations to look at occurrences of invasive animals in waters around Ketchikan, Alaska. They document the first and northern most record of an invasive branching bryozoan, Bugula neritina, as well as an invasive solitary tunicate, Ciona savignyi, which hadn’t been reported from Alaska since 1903. They also noted new occurrences of two species of invasive colonial tunicates, Botryllus schlosseri and Botrylloides violaceus, in new areas of around Ketchikan.

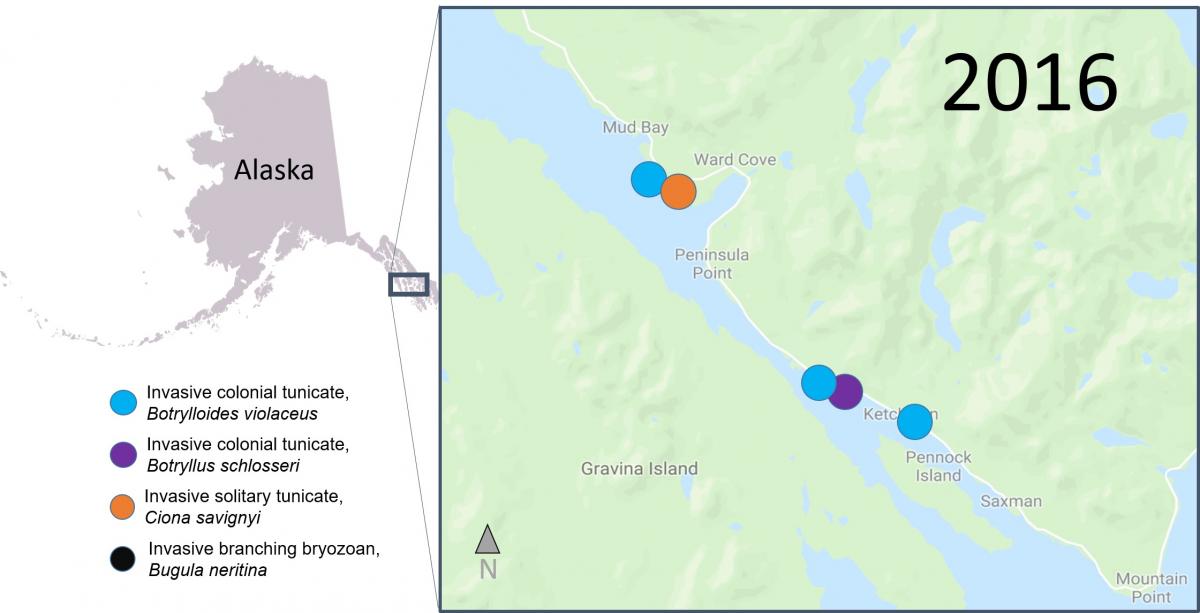
Scientists think that the high level of boat traffic in the region may have caused these species introductions. Researchers and volunteer scientists will continue to monitor the tiles to try to document any new invasions, and to better understand the impact invasive species have on the ecosystem. We couldn’t do this work without the help from local volunteer scientists!
![]()
BLUEBIRDS (VOLUNTEER RUN)

Box for bluebirds to nest.

Bluebird nesting in a bluebird box.

Bluebird eggs in a box.


People admire Eastern bluebirds for their beauty and songs, but the birds also help people by controlling insect populations. Farmers build bluebird nest boxes near fields and orchards to encourage birds to stay in the area and eat insects that could damage their crops. However, bluebirds are threatened by habitat loss and pesticides. In addition, invasive bird species often take over bluebird nesting sites. To restore bluebird populations, conservationists developed bluebird trails, in which bluebird nesting boxes are set up along a trail and monitored regularly. At SERC, volunteer scientists collect data along our bluebird trail once a week during the spring and summer. They share their results with groups, like the North American Bluebird Society, which use data from volunteer scientists to track changes in bluebird populations along the East Coast.
Since 2008, volunteer scientists have collected data from the 48 nest boxes at SERC. SERC interns looked at the data to see if there were patterns between environmental conditions and bluebird populations. The results showed that during harsh, cold winters there are fewer bluebird fledglings, especially when the temperature is below freezing for more than a week straight.

This year, the rainy summer made it tough for bluebirds and bluebird monitors alike! There were only 40 fledglings this year, about half as many as last year. The Maryland Bluebird Society observed similar patterns across the state. The constant rain made it difficult to check the nest boxes. There may have also been fewer successful nests. Many bluebird nests were built early in the spring, but abandoned before the bluebirds laid eggs.
To prepare for 2019, volunteers will be cleaning and winterizing the nest boxes. We are hoping for a better year with more fledglings in 2019. Bluebird monitoring is a completely volunteer-run project, and we are so lucky to work with people who are committed to bluebird conservation!
![]()
ENTOMOLOGY (VOLUNTEER RUN)

Volunteer entomologist, Charlie Staines, identifying SERC beetles.

Box of identified beetles. All of these beetles were collected on the SERC campus during 2018.


Although they give some people the heebie-jeebies, insects play many important roles in ecosystems. They act as pollinators for plants, including 35% of the world’s crops. They break down dead organisms and are an important part of the diets of lots of animals, like birds and amphibians. Despite their importance, recent studies suggest that insect populations around the world are declining rapidly (in some cases by upwards of 80% since the late 1980s) due to climate change, disease, and invasive species.
While SERC has lots of awesome researchers, we don’t have an entomologist (a scientist who studies insects) on staff. However, volunteer scientists Charlie and Sue Staines have been studying beetles for decades. Beetles are the largest group of insects (about 40% of all insect species are beetles), and they are found in all habitats except for the open ocean. This summer, Charlie and Sue started a beetle inventory to track changes in beetle populations on the SERC campus. They collect, preserve, and identify beetles from a variety of habitats. The beetle inventory will show us which beetles are present, how many are in the area, and the roles that beetles are playing in the local ecosystem. Having this baseline information will help scientists understand changes in the local beetle community through time. Researchers can use this information to assess the health of the SERC ecosystem and compare it to other areas.
![]()
FOREST ECOLOGY

Volunteer measuring dendrometer band to determine tree growth.

For the past 2 years, researchers from the Forest Ecology Lab have been tracking the growth of about 500 trees from the SERC campus and from the Harvard Forest Long Term Ecological Research site in Massachusetts. Generally, researchers don’t focus on individual trees, but look at broader patterns. However, the researchers think that by looking at individual trees, they will get a clearer picture of variation both within a single species and across different species. They track the growth of individual trees using dendrometer bands, or metal tree growth bands. Volunteer scientist, Jim Bryson, helped build, install, and monitor more than 500 dendrometer bands needed for the study. These bands help researchers understand how individual trees respond to changes in their environments.
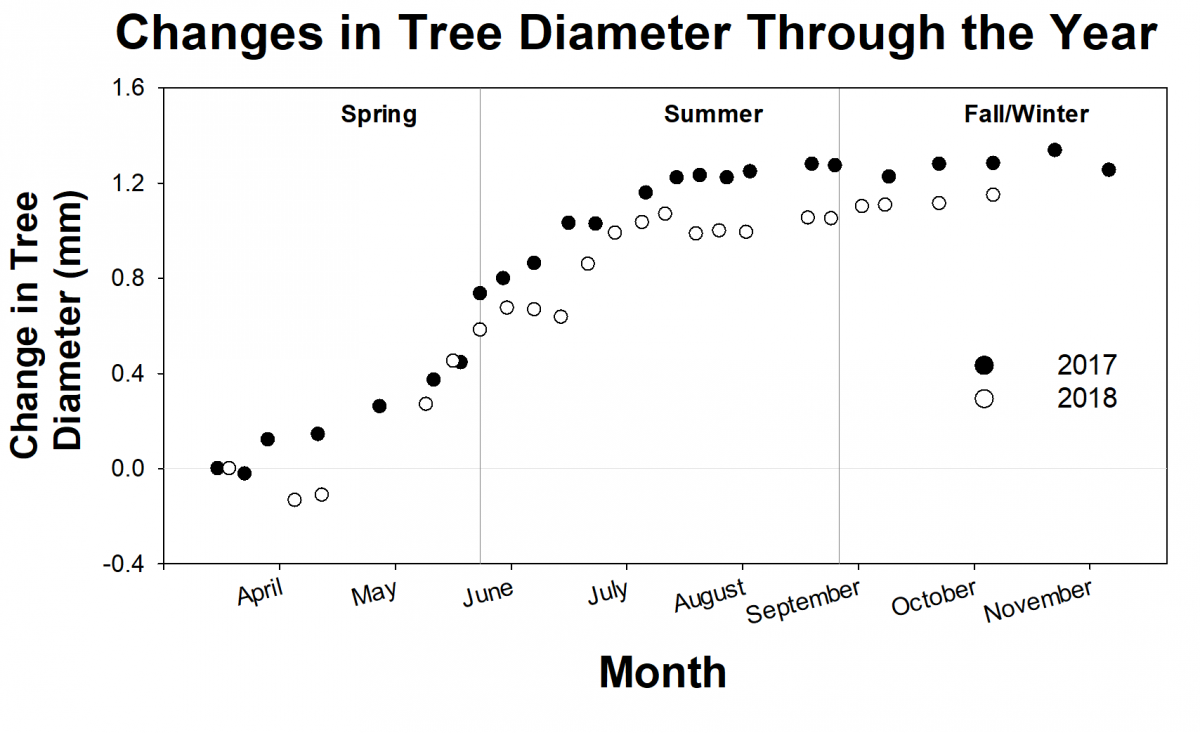
Researchers are still analyzing all of the growth data, but preliminary results suggest a pattern of growth across trees at both locations. The trees grow more and more quickly during the spring, level off over the summer, respond to weather events like droughts or hurricanes in the fall, and level off again during the winter. But some individual trees grow better than others, and researchers aren’t sure why. Along with the detailed growth measurements, researchers are collecting leaf samples for DNA analysis. This will allow them to ask questions about the influences of microhabitat and genetics on tree growth.
![]()
FOSSIL ATMOSPHERES

Volunteers, Jon Wilson and James Sappington, in front of the Gingko tree chambers.

Volunteers, Linda Davidson and Mason Scher, taking leaf samples inside one of the Gingko tree chambers.

Photograph of Gingko leaf stomata.


The Fossil Atmospheres Project is trying to understand what carbon dioxide (CO2) levels looked like in the distant past (think hundreds of millions of years). Researcher Rich Barclay, a paleobotanist from the Smithsonian National Museum of Natural History, and a team of volunteer scientists are running an experiment where they compare modern Ginkgo leaves with fossilized Ginkgo leaves that may provide some answers.
All plants, including ginkgos, take in CO2 from the air by opening stomata, or pores, in their leaves. They use carbon dioxide to make sugars that the plant uses as fuel to grow and reproduce. When there is less CO2 in the atmosphere, plants have more stomata on their leaves so that they can get enough carbon dioxide. When there is more CO2 in the atmosphere, there are fewer pores because it is easy for the plant to get enough CO2. So, by studying modern leaves grown under different amounts of CO2 and comparing the number of stomata they have to what fossilized leaves had, we can get an idea about what conditions were like when the fossilized leaf grew.
In the experiment at SERC, Dr. Barclay and the volunteer scientists are collecting data from 17 Gingko trees. Twelve trees are in chambers (similar to those used in experiments at our Global Change Research Wetland) with have various levels of CO2 and other control trees are not in chambers at all. The site runs 24 hours a day, 7 days a week, for 10 months, and requires daily maintenance to keep CO2 levels stable, so the volunteer scientists play a major role in maintaining the experiment and collecting data.
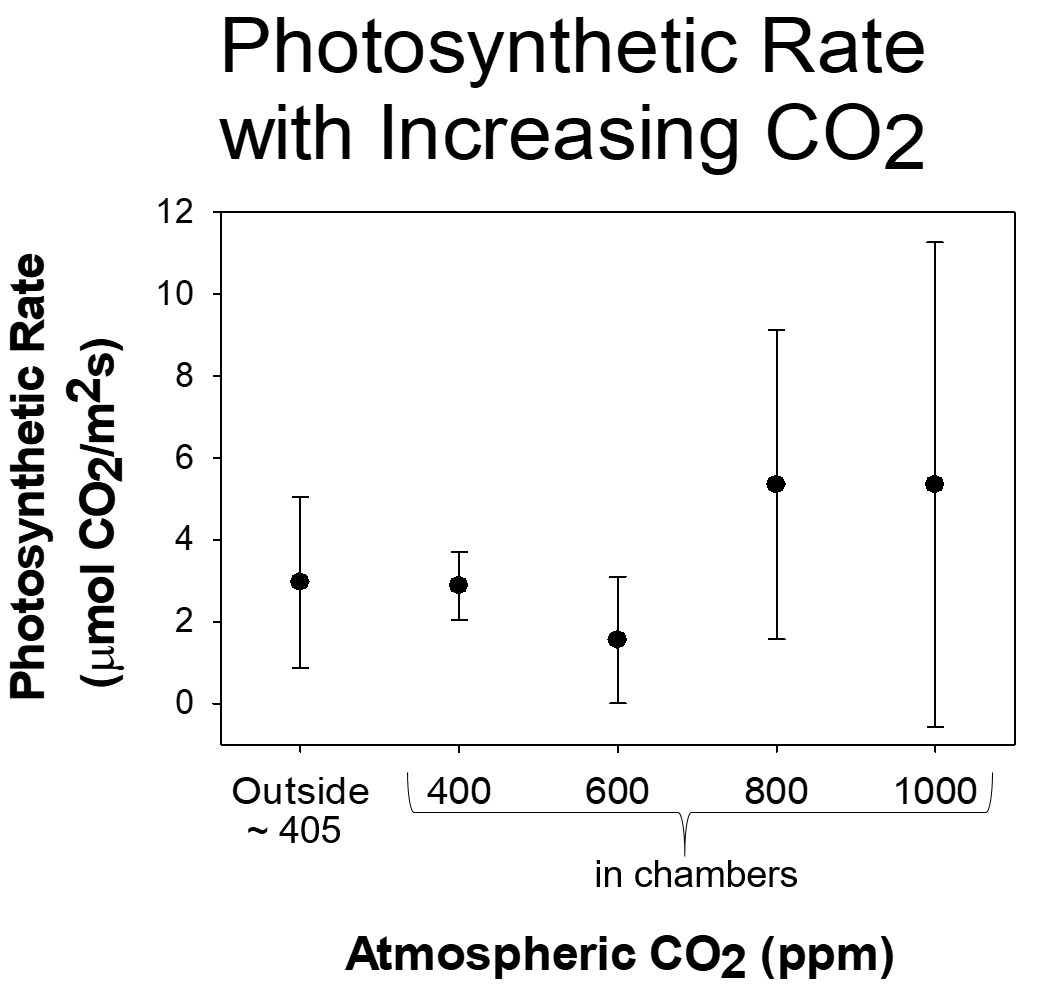
Because 2018 was such a wet year, the researchers not only had to deal with managing CO2 levels and collecting data, they also had to come up with creative ways to drain water from the chambers so that the trees didn’t drown! Most efforts over the year were keeping the Ginkgo trees alive, improving drainage, and making sure the temperatures inside the chambers didn’t get too hot. Despite the bad weather, they did collect data that show that the trees in the higher CO2 chambers have reduced numbers of stomata. And the trees with more CO2 are photosynthesizing and making sugars more than 4x faster than the control plants!
![]()
ORCHIDS IN CLASSROOMS

Students from Parkdale High School measure and plant orchids in their classroom.

Students at the Howard B. Owens Science Center measure their orchids.


Orchids are one of the most diverse groups of flowering plants on Earth. North America alone is home to over 200 species of orchids. However, more than half are endangered or threatened. Orchids are very sensitive to environmental change because they need environments that are not only healthy for them, but also for their pollinators and specific fungi that help them get nutrients.
Because orchids are disappearing, there is a need to learn as much as we can as fast as we can. This means that we need more data than researchers can collect by themselves. SERC orchid scientists are partnering with middle and high school students in Washington, DC and in Maryland’s Prince George’s and Montgomery counties to learn about best ways to restore orchids. In the spring of 2018, students began growing orchids in their classrooms. They were trying to determine if it matters where an orchid’s nutrients come from. In nature, orchids use fungi to get nutrients, but we don’t know if it is possible to grow orchids that are just as healthy without using fungi. If it is, will be much easier for greenhouses and botanic gardens to grow orchids for conservation projects.
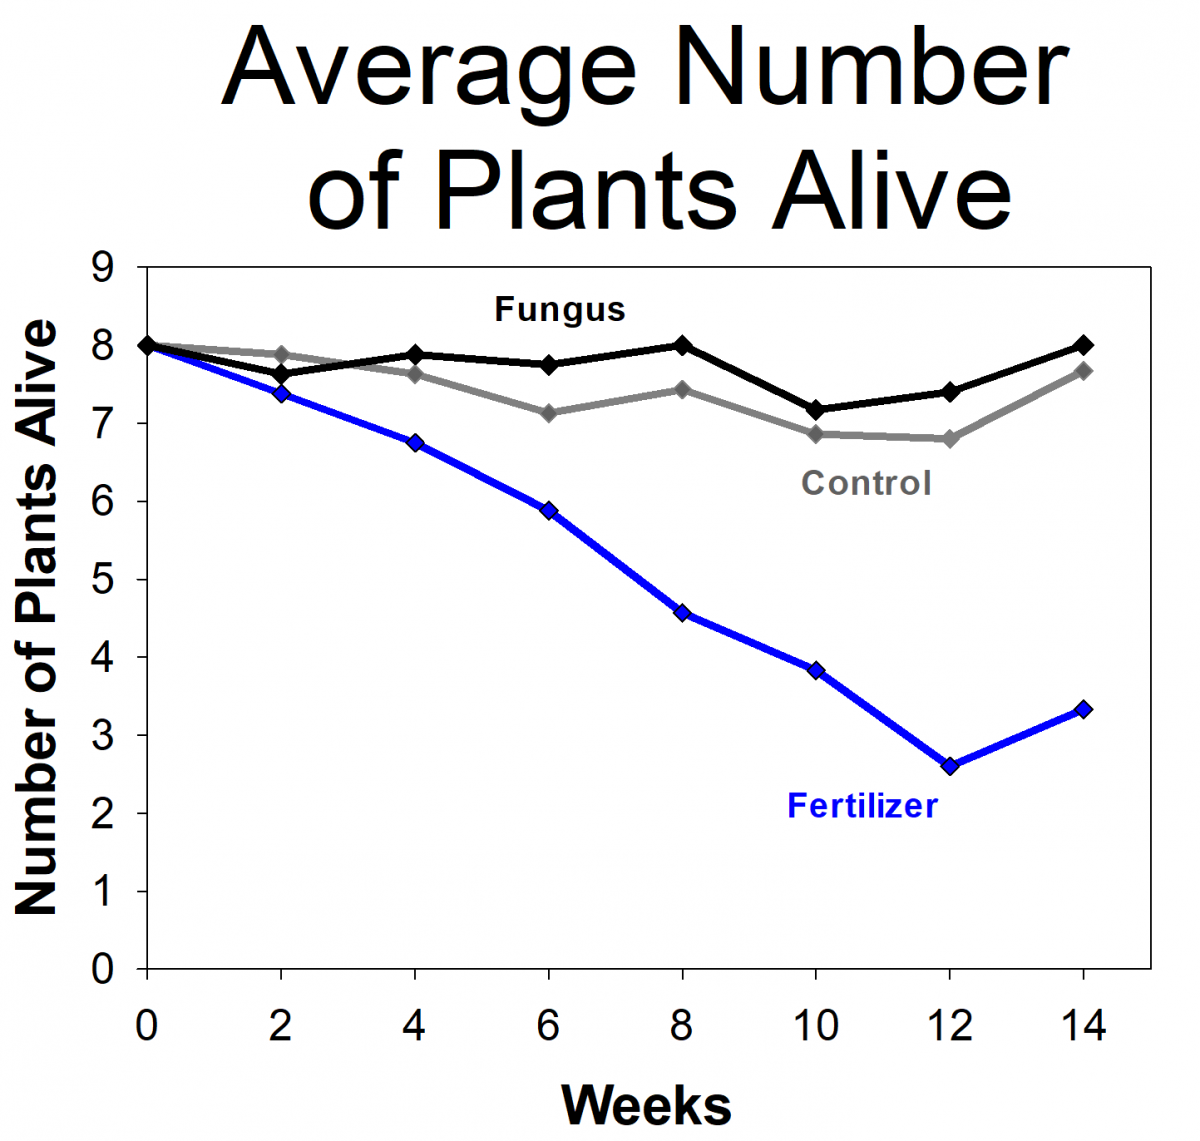
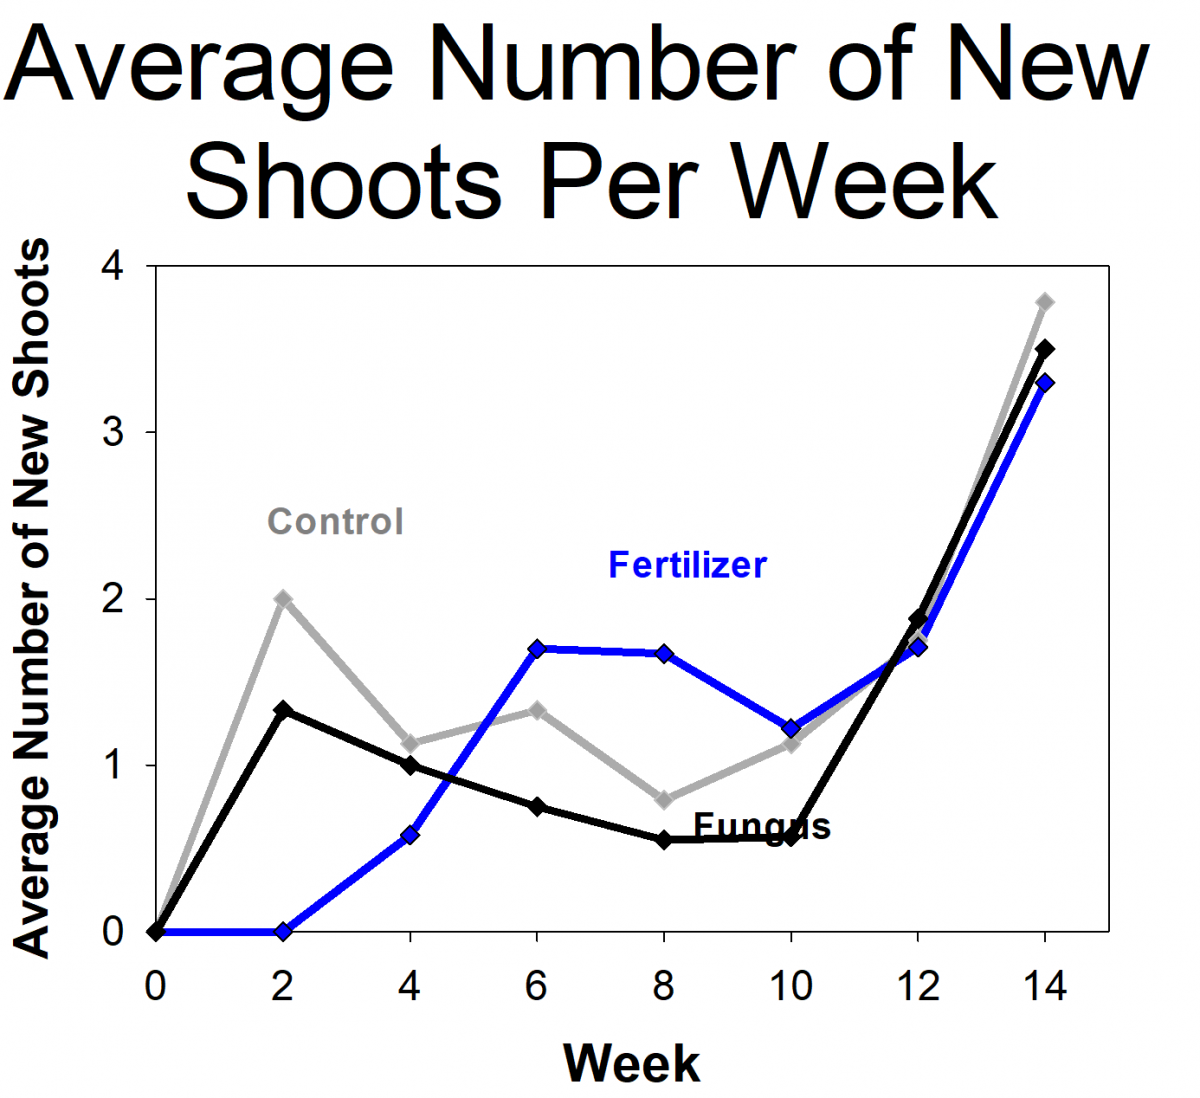
The students measured the growth of orchids that had fungi, orchids with fertilizer (but no fungi), and a control group that didn’t get fertilizer or fungi. The students found that the orchids with fungi were more likely to survive and grew more than the controls or those given fertilizer. In fact, the orchids given fertilizer had the lowest survival rates. The students and researchers hypothesized that this is because the orchids naturally grow in low-nutrient environments and were not able to handle the high levels of nutrients from the fertilizer. Based on their results, we modified the protocols for future projects, including reducing the amount of fertilizer we use. We are in the process of repeating the experiment using the updated protocols. If the results holds true for future experiments and more orchid species, it will have important implications on the way that researchers develop orchid conservation plans.
In addition to the scientific knowledge gained through the experiment, the project also had an impact on student attitudes towards science. Impressively, 76% of students reported that the project made them more interested in science and 54% reported that it made them more interested in school. We are currently analyzing student feedback about the project to see if it changed the way that students feel about their ability to do science. Participating teacher, Joyce Park, from Walker Mill Middle School, and SERC’s Cosette Larash will present these results at the 2019 Citizen Science Association Conference.
![]()
PROJECT OWLNET

Northern saw-whet owl.

Volunteers helping take measurements of the saw whet owl.


In 2017, SERC became a Project Owlnet northern saw-whet owl banding station. Project Owlnet is a network of banding sites that track population changes and migration patterns of northern saw-whet owls. Knowledge of where and when saw-whet owls migrate helps resource managers create plans and recommendations for land management and species protection. Each fall, northern saw-whet owls migrate down the east coast of the United States starting in northern Canada and traveling as far south as Georgia. Northern saw-whet owls are one of the smallest owls in North America, which make them easy prey for larger predatory birds. To avoid becoming a snack, saw-whets only migrate when it is dark and stay silent while they travel. Because they only migrate at night, are small in size, and are very quiet, we are still learning about their migration patterns.
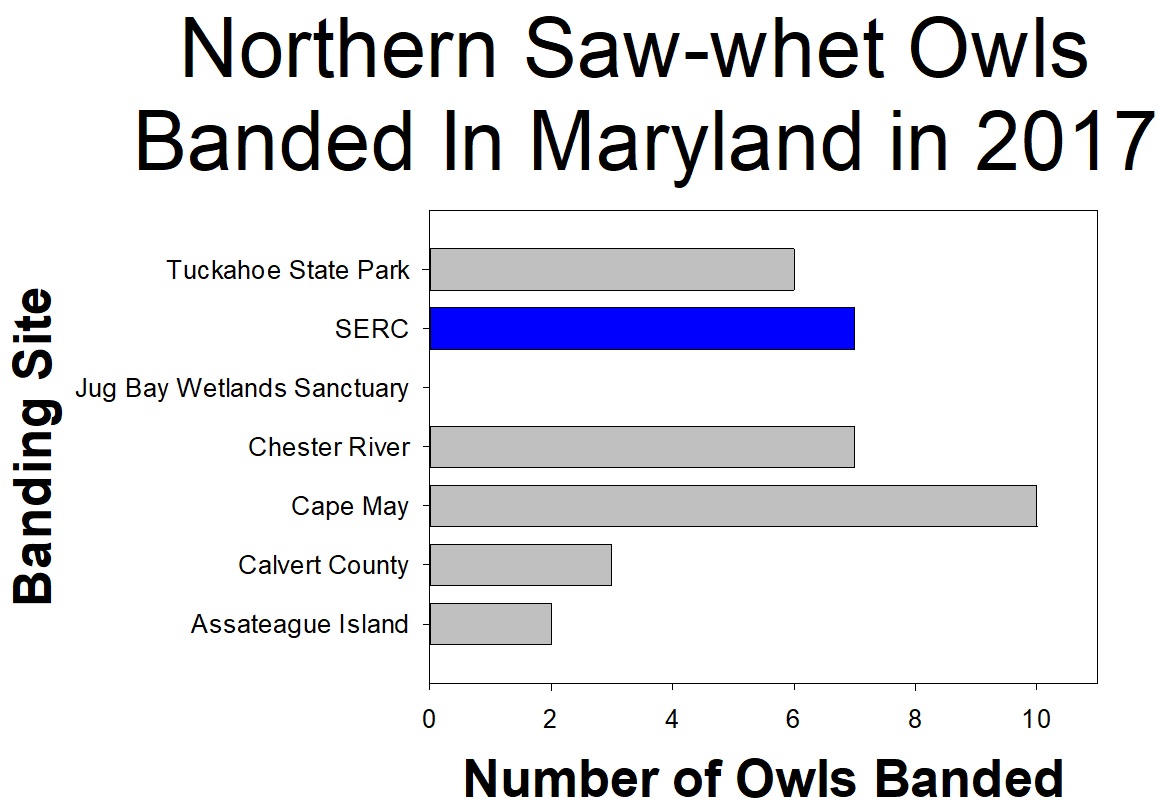
From October through November volunteer scientists helped researchers study the owls. Over the course of the 2017 season, seven individual owls were captured. The SERC site caught a total of eight owls because one owl was captured twice (on separate nights). Each night researchers and volunteers set up mist nets with an audiolure (playing owl sounds) placed in the middle. For each owl, we recorded when and where the owl was caught in the net. We also recorded data about the owl, including feather pattern, health, size, sex, and weight. The owls were also given individually numbered bands, issued by the USGS Bird Banding Laboratory, that were placed around one of their ankles. After all data was collected, the owls were released, unharmed, to continue their journey.
Even though seven owls may seem like a small number, other stations around the region saw similar numbers. Northern saw-whet owl populations seem to have a boom and bust cycle, where some years there are lots of owls and others there are very few. So it seems like 2017 was just a low owl year. Despite the small number of owls, the 2017 season did confirm that the owls migrate through SERC property. Continue to follow northern saw-whet migration next year!
![]()
PEPPER, THE HUMANOID ROBOT

Visitors pose for a photo with Pepper.

Left: South River High School Students Zach Livesay (left) and Dan DeRycke (right) transport Pepper. Right: Dan DeRycke (left) and Cole Kindig (right) program Pepper at SERC.

The students programmed Pepper to dab, which is a dance move.


In February 2018, the Smithsonian Institution received 12 Pepper robots from SoftBank Robotics. Pepper is a humanoid robot that can provide information, show photos, and dance. We hope to use Pepper to engage visitors in Smithsonian museums, research centers, and educational spaces in a new way.
SERC has two Pepper robots. Our first Pepper is ready and excited to meet all of SERC’s visitors! Pepper can dance, play games, pose for selfies, and can tell you all about SERC science. This robot has a plug-and-play software that staff is continuously updating to engage our visitors at various events.
SERC’s second Pepper is a blank slate, with no pre-programmed functions (so no dancing!). We’ve been collaborating with students from South River High School to program our second Pepper and figure out the best uses for the robot. Students have programmed Pepper to dab and open and close its hands like crab claws. They are also working with its image-recognition capabilities and trying to get it to navigate along a planned route.
Make sure to check out SERCs calendar to see when you can meet Pepper!
![]()
TEACHER EXTERNS

Teacher, Kelly Grun, taking temperature and salinity measurements in the Rhode River.

Kelly Grun, a teacher from Glen Burnie High School, helping with an experiment.

Teacher, Justin Celmer, and other volunteer scientists learning about experiments.

Teacher, Justin Celmer, and other volunteer scientists collecting data as part of the salt marsh plant census.


For the second year in a row, SERC partnered with the Anne Arundel County School District STEM Office to host teacher externs in SERC labs. The teachers spent three weeks embedded in a SERC lab, participating in a in a wide range of research activities. The teachers created project-based learning modules based on their experiences. They will use the learning module in their classrooms and it will be shared with teachers throughout the school district. This year, the SERC externs were: Justin Celmer, who teaches Education Technology at Lindale Middle School; Kelly Grun who teaches 9th grade at Glen Burnie High School; and Kim Cox, who teaches 10th grade at South River High School.
Justin worked in the Biogeochemistry Lab where he helped collect data as part of the Annual Salt Marsh Plant Census. Based on what he learned about the role that the salt marsh plays in keeping nutrient pollution out of the Bay, Justin was inspired to create a unit about environmental awareness and had his students create a physical model of a device that could be used to keep pollution out of the ocean.
Kelly worked with Dr. Christina Simkanin in the Marine Invasions Lab. She participated in a range of projects, including an experiment looking at an invasive sea squirt and the nearshore habitat survey. For Kelly’s module, she developed a creative writing project, where students analyzed texts, including “The Most Dangerous Game” to examine the connection between humans and animals. The students used this as the basis for a research project where they studied survival traits of animals and designed their own animal that would be able to survive in a large number of habitats.
Kim worked with the Ecosystem Conservation Lab on a project to understand the relationship between nitrogen-fixing bacteria and crop plants. They also looked at the effects of herbivore damage on plants. She created a module for her AVID students. The students grew lima beans in their classrooms, and developed and tested hypotheses about the best ways to maximize plant growth. The project gave them a chance to implement many steps of the scientific process and to share their findings with SERC scientists.
We really loved having all of our teacher externs here and are very grateful for the awesome work that they did this summer. We look forward to hosting another group of teachers in 2019.
![]()
LAB VOLUNTEERS

Volunteer, Janet Gingold, helping count soybeans for a project with the Ecosystem Conservation Lab.

Technician, Jamie Pullen (left) and volunteer, Abigail Cannon (right) harvesting soybeans for Terrestrial Ecology.

Catherine Sanos seining for the Nearshore Ecology project.

Volunteer scientists out in the field for the Nearshore Ecology project.

Mary Ann Christenson helping the Plant Ecology Lab create species distribution maps for their future orchid field guild.

Long term volunteer, Mark Sucy, returned to working as a machinist helping out in the fabrication of high-precision sensor mounts for the SERC monitoring program.

Long term volunteer, Nick “Shiver Me Timbers” Coleman, assisted the Nearshore Ecology project and then became an intern for the Fish and Invertebrate Ecology Lab.


In addition to our more structured Participatory Science projects, SERC also has a group of volunteers who aren’t part of specific projects, but work on a wide variety of activities within a lab. These volunteers are generally at SERC on a regular basis (one or more days per week), and they often have specialized skills and knowledge that they bring to the labs. They help with chemical analyses, build and maintain equipment, create content for websites, assit in the field, and a wide variety of other activities. Nearly all of the labs at SERC have at least one of these volunteers, many of whom contribute hundreds of hours per year to SERC research. They are integral parts of the labs and the SERC community, and we very much appreciate their time, talents, and dedication!