


Principal Investigator
The Forest Ecology Laboratory studies the structure, growth and function of forest ecosystems. We are especially interested in the canopies of deciduous forests.
We study the organization of forest above-ground components, the exchange of energy and material between the canopy and the atmosphere, and the physical environments within the forest. We hypothesize that the structure of the canopy influences the way forests work - our research aims to clarify the rules relating canopy structure and function.
Most of our research is centered in a tall, mixed species forest on the SERC property, where we also concentrate on long-term demographic characteristics of forest trees. We study these relations in other forests as well, including different developmental stages of the core forest type, and forests in other climates. With the understanding gained from these studies we hope to make general predictions about how forests change, control microclimate and water balance, accumulate carbon dioxide, and provide habitat for organisms.
The SERC Forest Dynamics Plot
The SERC Forest Ecology Lab has long used large-scale maps of trees as tools for understanding forests. In 1987 we initiated a study of all trees at least 20 cm in DBH (diameter at breast height) in a 46.6-hectare section of the central Java Farm (the "Big Tree" plot). The intent of this effort was to understand the variation of forest composition around a central meteorological tower, to learn about how forest canopies are sensed from airborne instruments, and to document how tree species react to differences in elevation and human modification of the landscape.
In 2007, SERC joined the Smithsonian's Forest Global Earth Observatory network, a project to track forest dynamics in plots all over the world. SERC took a 16-hectare section of the original larger study and incorporated it into the ForestGEO network. For the ForestGEO collaboration, we measure all woody plants with a diameter at breast height equal to or greater than 1.0 cm, map them to location, identify them to species, and assess them for condition every five years. The plot was established in the fall of 2007 and the first census was completed in August 2011.
Other studies on SERC's ForestGEO plot are primarily focused on tree demography and carbon dynamics in a human-dominated landscape. The plot has 3 small buildings (0.97 % of the area) and some roads, paved and unpaved (3.92 % of the area), for a total forest area of 15.36 hectares. Such evidence of anthropogenic activities is typical of this region, which has long been impacted by humans, particularly by European colonists since the middle of the 1600’s. The majority central portion of the plot was most likely a pasture until abandonment in the late 1800’s. To the southeast and northwest edges of the central core are younger stands, both of which were fields abandoned in the 1930’s. These two stand age classes are the dominant ones in the region.
The plot is located about 10 km southwest of Annapolis, Md., on the western shore of the Chesapeake Bay. It is in the coastal plain physiographic province and has a substrate of deep sediments. The geographic boundaries of the square plot are 38.8873020 to 38.8910041° N (latitude) and 76.5618021 to 76.5571295° W (longitude). The site sits close to sea level (0.2-12.0 m elevation range) and is mostly flat (slopes average 8.4 ± 7.2°). However, a stream and its floodplain curve through the plot from the NE to SW. Precipitation, mostly rain, averages 1090 ± 172 mm annually; the mean temperature is 12.8 ± 0.7 ° C (NOAA regional climatology 1895-2010).
The forest is diverse (78 species) and includes two distinct associations: the upland portion is in the ‘tulip poplar’ forest type and the wet areas are of the ‘river birch-sycamore’ group. The shrub spicebush (Lindera benzoin) numerically dominates, primarily in the lower elevations. Biomass is dominated by tulip poplar (Liriodendron tulipifera), sweetgum (Liquidambar styraciflua) and American beech (Fagus grandifolia). It has a total of 33426 stems (2177 ha-1) of which 7.07% are dead. Mean basal area is 40.8 m2 ha-1 and above-ground biomass 381 Mg ha-1.
For further information on the study and enquires about collaboration, contact Geoffrey Parker (parkerg@si.edu).
The Forest Canopy of the World - a project to compare structure globally
The SERC Forest Ecology Lab has long been concerned with the structure of forest canopies. To make these measurements in an objective and repeatable way, we developed a portable, ground-based LIDAR system, called the Portable Canopy LIDAR (PCL) [link to publication – Parker et al. 2004.] In the past our principle focus was on the canopies of forests of different ages in the neighborhood of SERC. But more recently we have concentrated on forests throughout the world. Ultimately we hope to measure examples of most of the dominant types of forests in all the climate zones where forests are common. This global-scale information can then help us to understand the components of canopy structure and their dependence on major climate patterns.
Geographic and climatic coverage of the project
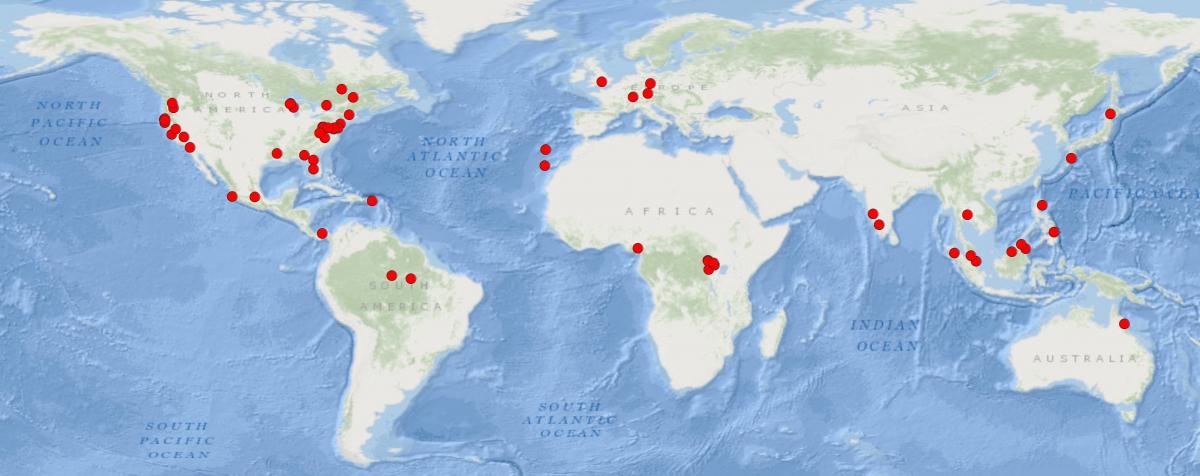
The PCL system has been deployed at more than 60 regions throughout world in more than 100 distinct stands (Figure 1), covering about half of all climates supporting forests (Figure 2). It has been used by about a dozen different groups of researchers. Many of the researchers using our system have been trained in our lab and have shared their field data with us.
Most of the studies are of intact mature forests, but some projects focused on younger stands. At every site the studies cooperate closely with local investigators to choose appropriate stands, to share the methodology and to analyze the data. Currently the distribution of studied forests is incomplete—it is biased towards well-developed regions in the northern temperate zone and some intensively-studied sites in the tropics.
Measures provided
To operate, researchers carry the PCL along lines on the forest floor, while the upward-looking laser rangefinder makes high-frequency distance measurements. The system yields a wealth of information, including a visual slice of the canopy surfaces above the route walked. This representation shares several similarities with the CAT-scans (Computerized Axial Tomography) used in medical imaging. Among the specific measures we extract are:
- the height of the canopy (useful for estimates of biomass and carbon)
- the texture of the canopy surface (useful in studies of atmospheric-surface exchanges)
- the internal complexity of the forest (useful for assessments of habitat and biodiversity)
- the porosity of the canopy
- the fraction of ground open to the sky (useful in understanding radiation balance)
Taken in combination these measures help identify the forest type, its developmental state and its disturbance condition.
Results
Data from this study will allow, for the first time, direct comparisons at a global scale using a standard methodology (sampling system, data reduction and metrics). The results will be useful for:
- researchers concerned with canopy structure and climate-forest interactions,
- public audiences concerned with environmental matters, and
- calibrating global-scale studies of forest characteristics acquired from airborne or space-borne vantages.
Next steps
For a complete global picture, we need samples from forests in underrepresented regions. The highest priority regions are: the taiga (boreal forests), tropical savannas and dry forests, and tropical montane forests.
How we measure tree growth
Most measurements of tree diameter are made using a tape measure wrapped around the trunk at a standard height above ground. This measure is called the 'diameter at breast height' (DBH). However, the use of the tape measure is subject to several errors, such as inconsistent placement of the tape on the tree and the limited resolution of the measuring tape. The errors are large enough that annual tree growth can't be reliably estimated. Because of these uncertainties, trees are typically only remeasured every few years. A consequence of this long interval is that it is hard to relate the change in diameter to the many variations in weather and other environmental factors that can occur between measurements.
An alternative method, using manual band dendrometers, can provide the consistent, accurate and short-term measurements needed. A dendrometer band consists of a long strip of stainless steel that wraps around the trunk, held tightly against the trunk with a strong steel spring. One end of the band overlaps with a rectangular open section on the other end, revealing a gap where one can see the trunk. As the tree grows in circumference the band end recedes and the gap in the open section grows wider. The increase in the width of the gap is equivalent to the increase in the tree circumference. And, as the gap width can be measured very precisely (to within 0.01 mm, with a digital caliper) the dendrometer band provides a way to make detailed and repeatable measures of a tree's size and growth over many years.
We intended to use the dendrometers primarily to supplement the typical tape measure approach with annual observations. But the method may be used to measure tree sizes at many time scales: weekly, daily and even hourly. We discovered that changes in tree size are sensitive to different environmental effects at each of these scales. At each scale, the trees show coordinated changes in diameter – all sizes of trees in an area show the same pattern of change, although the pattern in the smaller trees is reduced compared to the pattern in the large ones. Over a year the total growth is most sensitive to the amount of rainfall in the early spring. And as precipitation changes from year to year, total growth also varies widely. Within a year, the timing and amount of growth seems to depend on the trees' access to light – trees with well-illuminated crowns start growth sooner and grow more than do those are shaded. Over many days the tree diameter is very sensitive to changes in soil moisture. During a dry period, the diameter change may slow down, or even stop, if the drought continues long enough. A tree stem's diameter even fluctuates on a daily schedule – they are larger in the early morning and shrink somewhat during the day. Overall, we've found trees are far more sensitive than previously imagined – they can provide a useful barometer of forest responses to climate factors.
Since we began our dendrometer measurements in 2009, the Forest Ecology lab has expanded the use of this method to projects focused on many different factors at SERC and to comparisons of tree growth among other sites, such as those in the Smithsonian Forest Global Earth Observatory (ForestGEO).
Make and use your own dendrometer bands
Read the instructions on how to make a dendrometer band, which include how to install the bands and make measurements and how to calculate estimates of tree size and growth. You will also find an example dataset on the growth of several trees at SERC using dendrometer bands, and some historic data on local climate if you want to explore.