2016 Participatory Science Annual Report
To view and download the PDF version of the newsletter click here.
Participatory science is a special kind of volunteering, because your contributions help us create new knowledge. When you volunteer with one of SERC’s participatory science projects, you are helping to further our understanding of important environmental issues, like invasive species, habitat restoration, and climate change. We want to make sure that not only do you know that we appreciate your efforts, but that we actually use the data that you collect as part of our ongoing research projects. Science moves slowly, so it may take a while to have enough data or to interpret all of the results, but we believe it is important to share the progress with you and to let you know the kinds of things that you played a part in discovering and understanding.
Thank you for all that you do as part of the SERC Particapatory Science program and we look forward to more new findings next year!
Check out what we were up to, by clicking on a project to learn more about it:
Topic |
Project Name |
| Environmental Chemistry | The Salt Marsh Plant Census The Stream Restoration Project |
| History | Archaeology (volunteer run) |
| Marine and Estuarine Ecology | Photobiology and Solar Radiation River Herring Conservation Ocean Acidification Room of Doom |
| Marine Invasions | The Chesapeake Bay Parasite Project Plate Watch Green Crabs Oyster Drill Nearshore Sampling |
| Terrestrial Ecology | Plant Ecology BiodiversiTREE Mangroves Bluebirds (Volunteer run) |

THE SALT MARSH PLANT CENSUS

Volunteer scientists working in the field.

The new warming part of the marsh was measured for the first time this year!

Volunteers help researchers measure salt marsh plants.

Join us in 2017!


The Global Change Research Wetland (GCReW) team has been conducting research on SERC’s Kirkpatrick Marsh for 30 years! Researchers and volunteer scientists collect data about how different marsh plants respond to increased levels of carbon dioxide, nitrogen, invasive species, and rising temperatures. Every year, the research team measures the height and width of thousands of marsh plants. In 30 years of data collection, this adds up to measurements for nearly 300,000 plants! That requires an enormous amount of effort, and dedicated volunteers have played a vital role in collecting this huge amount of data.

This spring, GCReW added a new experiment. A team of researchers and volunteer scientists constructed two new experimental plots in the marsh to study the impacts of rising temperatures. The plants in this study are heated from below by heating coils in the soil and from above by heat lamps (kind of like an oven broiler!). The temperature is raised by 5ᵒC, which is the expected rate of global temperature rise over the next 100 years. These heated plots are located beside unheated control plots so that researchers can look for different responses from the plants. As an example, researchers took the pictures in early October, when plants in the unheated (control) plots (left) had already started to die back for the winter. However, the plants in the heated plots (right) were still green! In addition to monitoring these types of changes next year, the researchers will begin to look at warming in combination with increased carbon dioxide and nitrogen, to understand the combined impacts of climate change on the marsh. Stay tuned for more results and join us for more Marsh Madness in 2017!
STREAM RESTORATION

During restoration, backhoes filled the stream with wood chips and sand.

This is what the stream looked like after restoration

"I've had a ton of fun and learned a whole bunch about environmental chemistry and the stream project."-Keidra Douglas, Nutrient Ecology Lab volunteer.

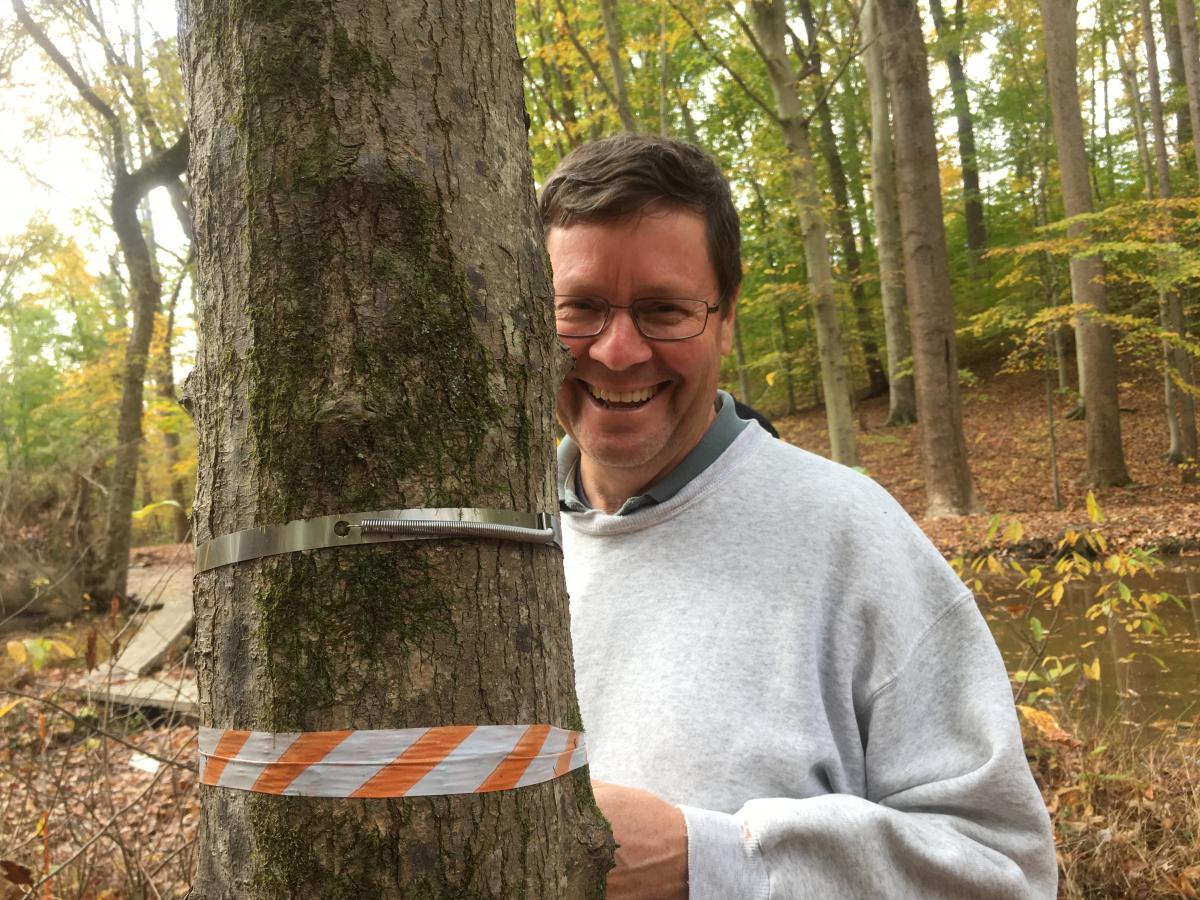
Plant ecology volunteers Steve and Jon measure trees at the Stream Restoration site.


Despite a widespread acknowledgement that many streams throughout the United States are degraded and despite a desire to restore many of those streams, there isn’t actually a lot of scientific data to tell us which stream restoration strategies are most effective. In order to understand how a restoration effort works, you need to have data about a stream before the restoration, be able to monitor it after its restoration, and, ideally, compare it to other nearby, non-restored streams. That is exactly what researchers and volunteer scientists from SERC’s Nutrient Ecology, Plant Ecology, and Biogeochemistry Labs are trying to do by studying Muddy Creek, a recently restored stream on the SERC campus. SERC has a long history of studying streams, and we have long-term data sets about many of the streams on our campus. Because we know exactly what Muddy Creek was like before the restoration and because we collect data about lots of other nearby streams, we are in a great position to understand how stream restoration strategies work.
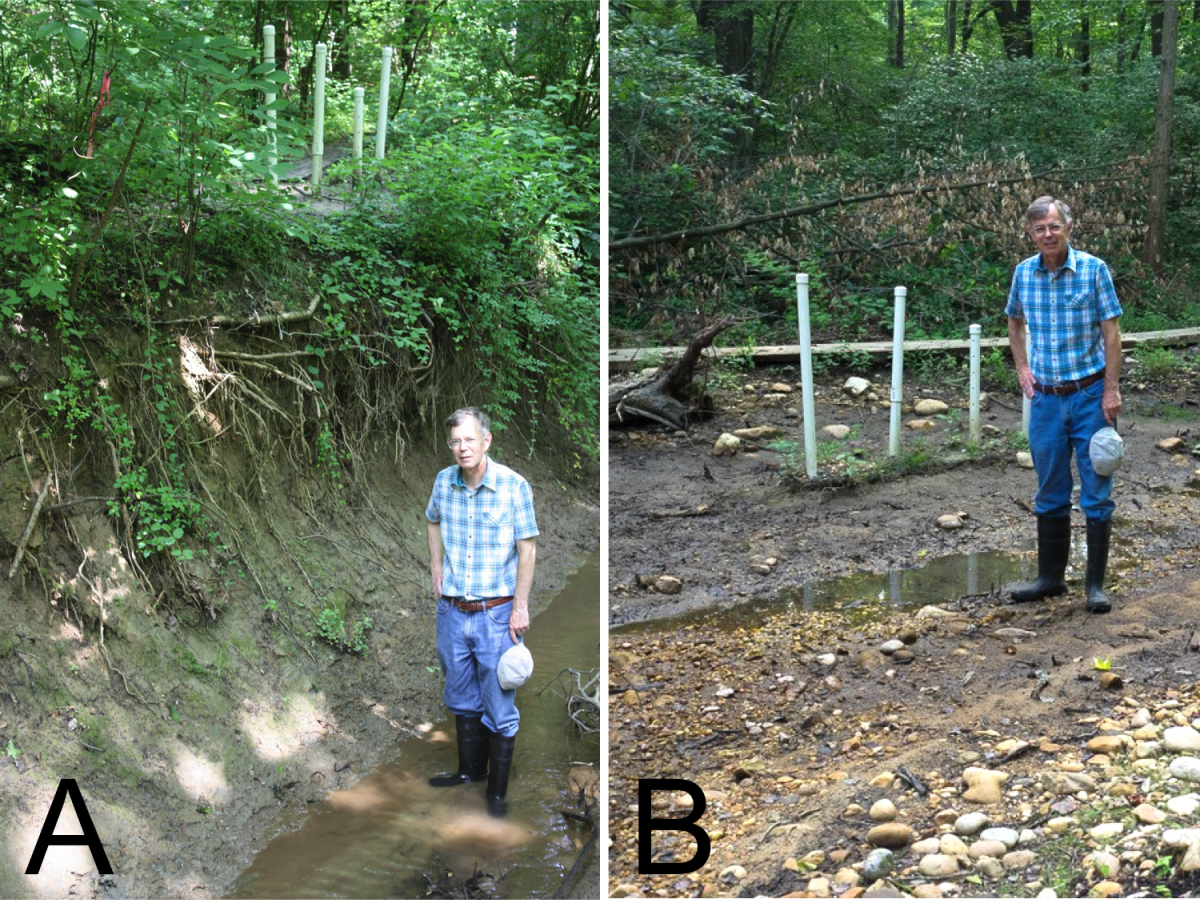
Before it was restored, Muddy Creek was heavily eroded. As part of the restoration, the stream channel was raised, so that the stream is now more or less level with the ground around it (called a floodplain). The restoration also created pools in the stream, which will slow the flow of the water. If the restoration works as intended, when there is a rain event, water can now spill over the edges of the stream into the floodplain instead of speeding down the streambed and causing more erosion. The slower flow also allows more time for natural chemical processes and sedimentation to occur, which can help reduce the amount of nutrients and sediments that enter the Bay and increase the amount of dissolved oxygen in the stream.
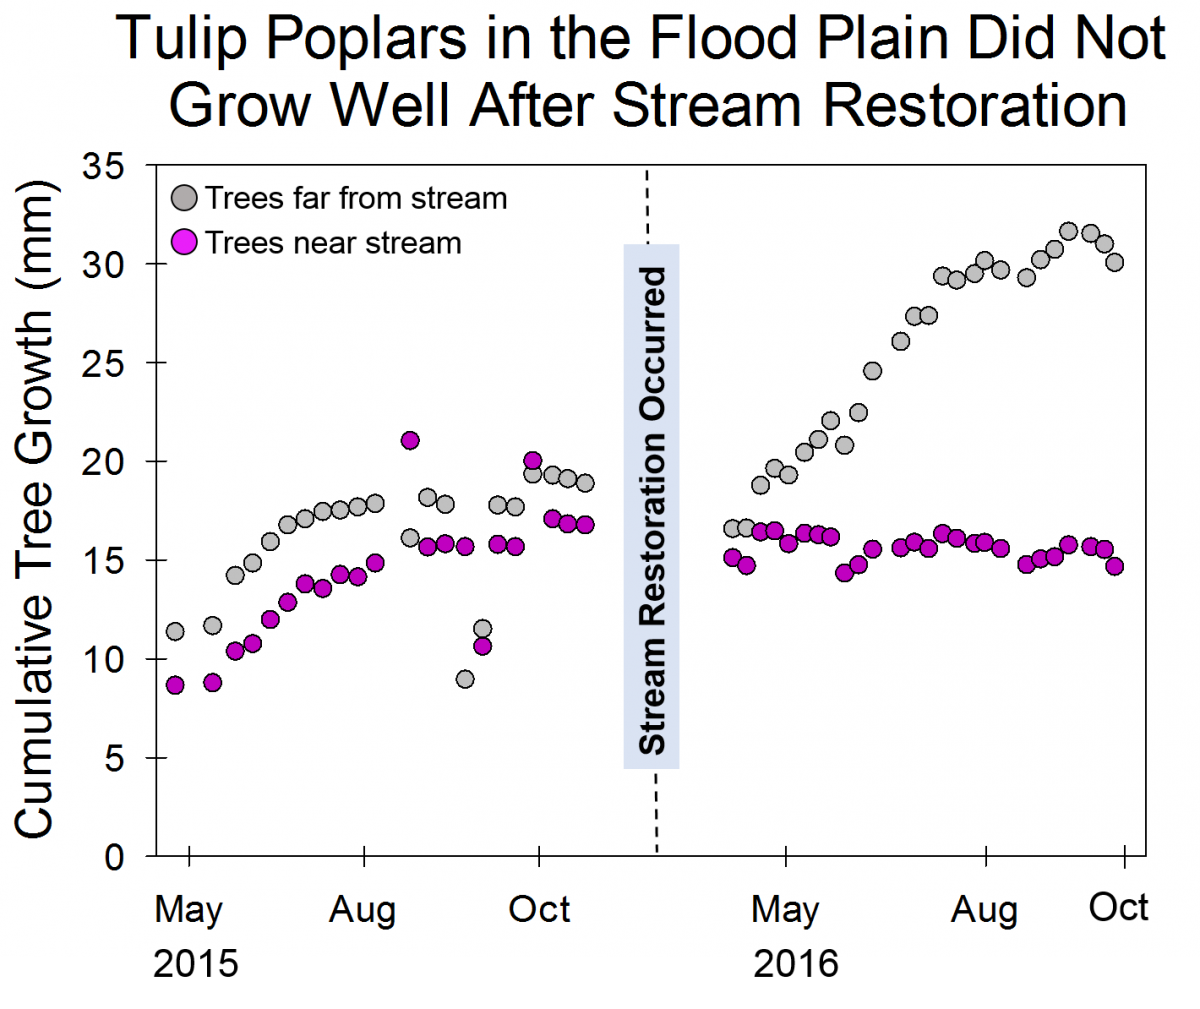
These changes not only affect the stream itself, but the floodplain too. Healthy streams can overflow into the floodplain and the plants that live in the floodplain will absorb some of the excess water. However, in an eroded stream, the stream and the floodplain are disconnected, meaning that the plants in the floodplain rarely get wet. Because Muddy Creek was in bad condition for a long time, many of the plants in its floodplain are not plants that can tolerate living in wet soil (whereas in healthy stream ecosystems, the plants in the floodplain are well adapted to wet conditions). The team from the Plant Ecology Lab began tracking the growth of trees in the floodplain before the stream restoration and continued making these measurements after the restoration was completed. Some of the trees that they are tracking, like Tulip Poplars, generally aren’t parts of healthy floodplains. The Tulip Poplars were able to grow well near the stream when the floodplain and the stream were disconnected, and the soil generally stayed dry. After the restoration reconnected the stream and the floodplain, the Tulip Poplars growing close to the stream have grown much more slowly than those outside the floodplain because they are not well adapted to growing in moist soil. By the end of the growing season, many of the Tulip Poplars in the floodplain had died. In contrast, the Red Maples in and out of the floodplain continued to grow at similar rates because Red Maples are well adapted to moist, floodplain soils.
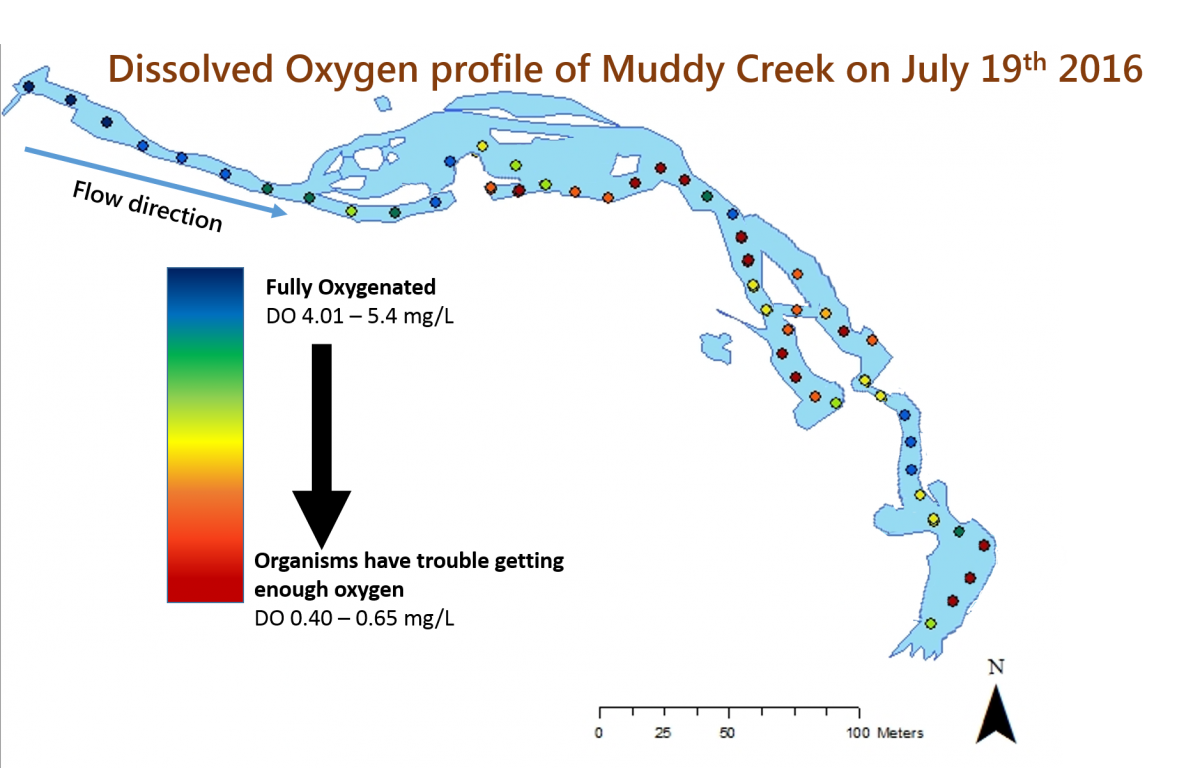
The team did not expect all of the results that they have seen (which is one of the most fun parts of doing science!). The team from the Nutrient Ecology Lab expected to have high levels of dissolved oxygen throughout the restored section of the stream. However, measurements have shown that while there is high dissolved oxygen in the upstream portion of the restored stream, many of the downstream sections have very low levels of oxygen. The researchers believe that this is because there are lots of bacteria in the stream, which are using up all of the oxygen in those areas. There are a few downstream areas with high oxygen levels. These are places where the water flows over rocks, allowing oxygen from the air to dissolve into the stream. However, the bacteria quickly use up this oxygen.
ARCHAEOLOGY

The Sellman House (or Homestead House) is where the Archaeology Lab is based. Photo by Samuel Lo.

Volunteers work on a Saturday Dig Day. Photo by Samuel Lo.

Volunteers search for artifacts. Photo by Samuel Lo.


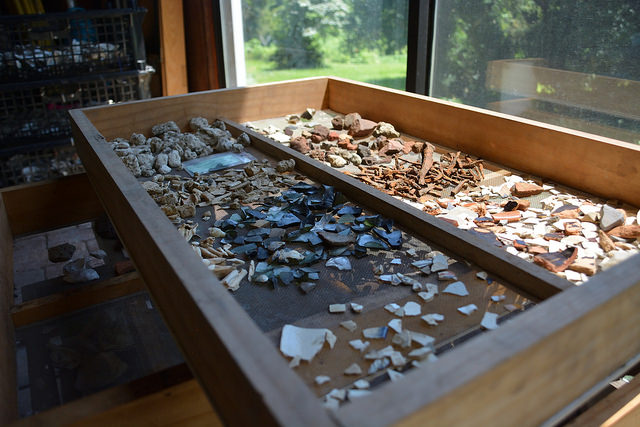
Our Environmental Archaeology Lab has been collecting data from sites at SERC and around the Chesapeake region since 2012. Much of their data comes from sites throughout the SERC campus that have been populated by Native Americans, colonial families, enslaved Africans, and tenant farmers. This lab is entirely run by volunteer scientists, who have contributed over 2,000 hours to the lab over the last year.
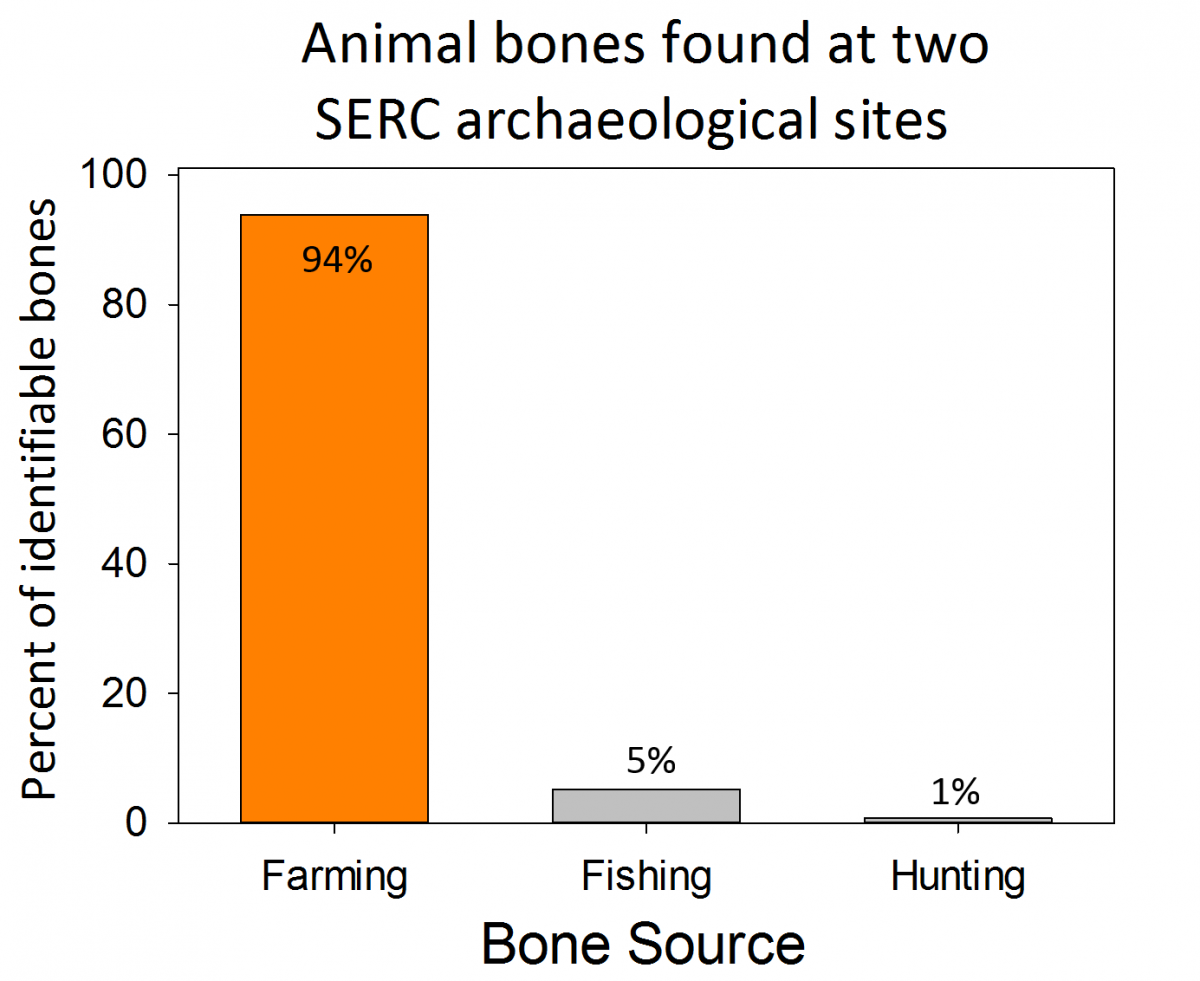
Volunteer scientists can volunteer and help with day-to-day tasks (like sieving sediments and washing artifacts), contribute to analyses, or even develop their own research projects. This year, our volunteer scientists presented their research at the Middle Atlantic Archaeological Conference in Ocean City, Maryland, the Council for Northeast Archaeology in Ottawa, Canada and will be presenting at the Society for Historic Archaeology in Fort Worth, Texas in early 2017. Their research topics included studies on the social organization of colonial elites, erosion and sedimentation at colonial sites, dietary preferences of two 17th century households, and comparisons of tenant farm houses. Three of the volunteer scientists, Sarah Grady, Valerie Hall, and Sarah Janesko, also wrote an article about SERC’s archaeology participatory science program that was published in the journal Practicing Anthropology.
PHOTOBIOLOGY AND SOLAR RADIATION

Volunteer Tom Long using machinery in the fabrication shop.

Instruments on the meteorological tower record weather and atmospheric data.

Volunteers and staff work together to collect meteorological data!


If you’ve spent much time at SERC, especially in the fall and winter, you may have noticed the Meteorological Tower on the hill behind the Mathias Laboratory. You might even have gotten the chance to climb it during Open House! The Photobiology and Solar Radiation Lab has lots of instruments at the top of the tower that constantly collect data about the amount of UV radiation hitting the sensors. These data are part of a long-term data set - one that’s been running since 1976 and at SERC since 1986! Researchers use the data to understand how UV radiation affects organisms, especially in aquatic systems like the Rhode River Estuary. The lab relies on volunteers to help maintain the equipment, including fixing instruments in the fabrication shop. Volunteers also help by creating schematics and machine plans using computer-assisted design. For examples of the kinds of data the volunteers help collect, you can look at the current UVB measurements and weather information.
Data sets like this would not be possible without the help of dedicated volunteers who help keep the program running smoothly!
RIVER HERRING CONSERVATION

Volunteer samples for herring eggs in the stream.

Volunteers help SERC scientists collect samples.

Volunteer Dave Norman has been working with the Fish and Invertebrate Ecology Lab all year!

Volunteers help gather data about river herring.

Volunteers gather data about river herring.

Volunteers collect herring egg samples.


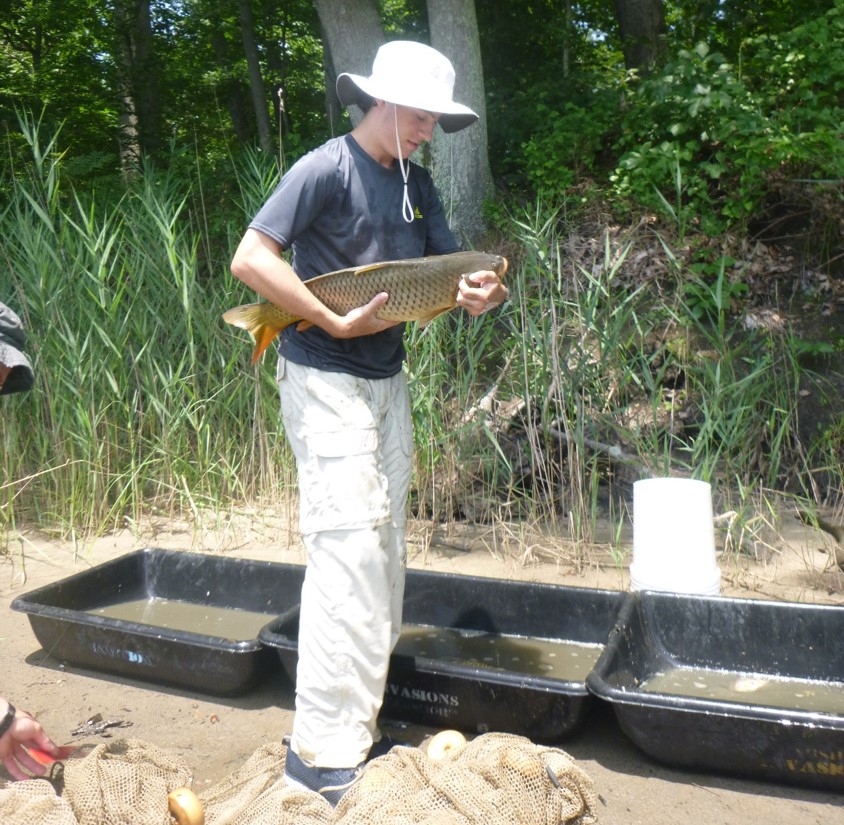
The Fish and Invertebrate Lab at SERC has been studying the movement of river herring in the Chesapeake Bay since 2012. River herring spend most of their lives in the ocean, but swim into streams to spawn. As they migrate into freshwater, they have historically been an important prey item for many Bay species including heron, eagles, osprey, and rockfish, and there were once large herring fisheries in the Chesapeake Bay. However, river herring populations crashed in the late 20th century, and there is currently a complete ban on fishing for river herring in many parts of the East Coast, including the Chesapeake Bay. Researchers believe that dams, which block herring from reaching their upstream spawning habitats, were a major contributor to the population decline. However, there is an ongoing effort to remove many of the dams and other stream blockages in the Chesapeake region, which will continue to open up a lot of “new” river herring spawning habitat. SERC researchers are interested in seeing how river herring will use this new spawning habitat as it becomes available. By understanding which habitats the herring are most likely to use, regulators can better prioritize habitat restoration to best conserve and restore river herring populations.
SERC researchers, with the help of volunteer scientists, observe adult river herring and collect some of their eggs from streams to understand the habitats they are using for spawning. Samples were taken above and below places where dams were removed so that we will know if river herring start to use newly available habitats. Because our current methods rely on actually being in the stream to see herring and collect eggs, and because there are only so many researchers in the lab, we are looking for new ways to engage volunteer scientists to study more streams in more parts of the Bay.
The researchers would particularly like to acknowledge the efforts of volunteers from Friends of Bohemia and the Elk and North East Rivers Watershed Association for scouting sites and helping in the field this past spring. We also want to extend a huge thank you to those that spent hours working in the lab—we look forward to working with you next year!

OCEAN ACIDIFICATION

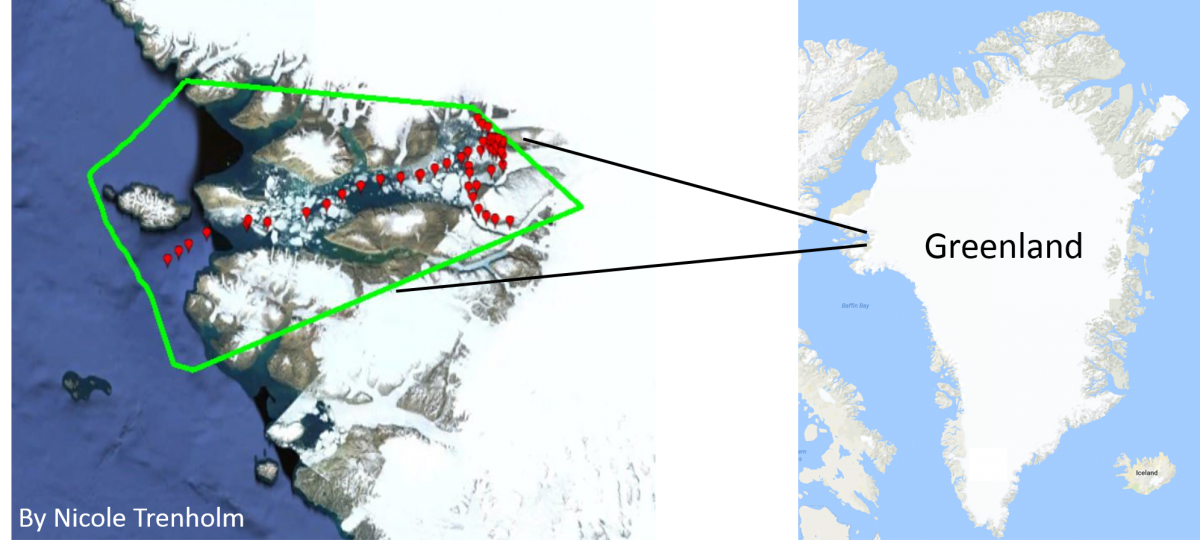
The Ault in Greenland. Photo by Alex Stillson

Matt Rutherford, Nicole Trenholm, and their crew in Greenland. Photo by Nicole Trenholm.

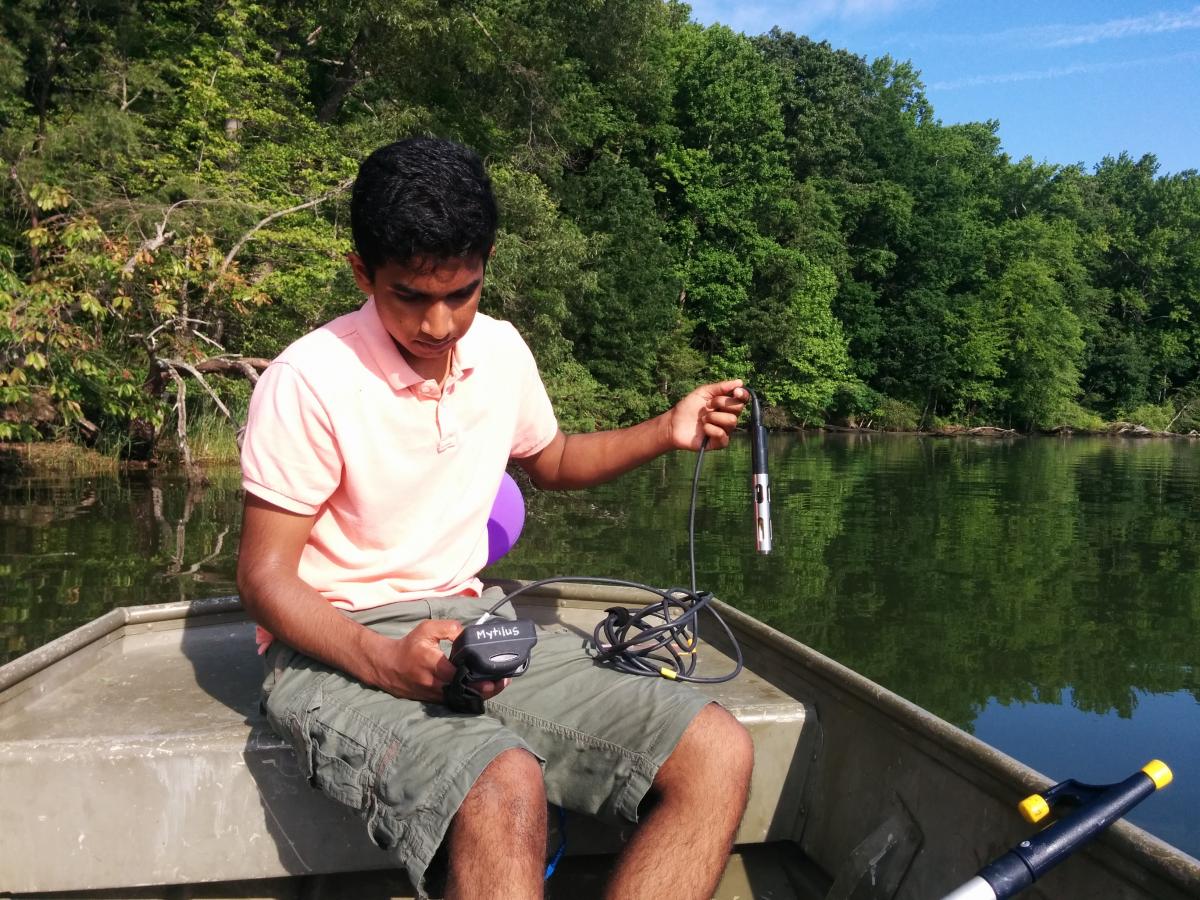
The CO2ScoutTM on the boat! Photo by Nicole Trenholm.

Taking samples on the boat. Photo by Nicole Trenholm.


SERC’s Ocean Acidification Lab tracks the effects of elevated carbon dioxide in marine ecosystems. As carbon dioxide increases in the atmosphere, it also increases in the ocean. Increased CO2 in the ocean lowers the pH of seawater, making it more acidic. You can learn more about how ocean acidification happen by clicking here.
Scientists at SERC are studying ocean acidification because it has widespread effects on marine ecosystems. Animals like corals, oysters, and snails have trouble building and maintaining their shells when they grow in acidic waters. Our researchers want to monitor, measure, and understand how acidic conditions are affecting the chemistry and ecology of ocean ecosystems around the world.
But measuring the CO2 and pH of an entire ocean can be tricky, especially in coastal areas where acidification is affected by many different things! Most sensors that accurately track carbon dioxide and pH in the ocean are expensive and only measure relatively small ranges of pH. To get around this problem and make more measurements in more places, our scientists have developed a prototype CO2 sensor called CO2ScoutTM (patent pending) that can be mounted on docks or small boats to continuously track the carbon dioxide in the water. Matt Rutherford and Nicole Trenholm, who run the Ocean Research Project, have used the CO2ScoutTM on their sailboat, The Ault, during trips from Maryland to Greenland and back, measuring CO2 all along the way. We hope to use their experiences and the data they collected to figure out the best ways to train volunteer scientists to use the CO2ScoutTM in more places.
We’re excited to work with Matt, Nicole, and their crew to find more ways that volunteer scientists can help us understand ocean acidification around the world.
THE ROOM OF DOOM
Researchers and volunteer scientists in the Marine and Estuarine Ecology Lab study how low dissolved oxygen (hypoxia) and low pH (ocean acidification) affect organisms that live in Chesapeake Bay. They conduct most of their work in a lab known as the Room of DOOM (technically, it is the Dissolved Oxygen Oyster Mortality lab, but DOOM is much cooler!) in the wet lab near the Reed Education Center.
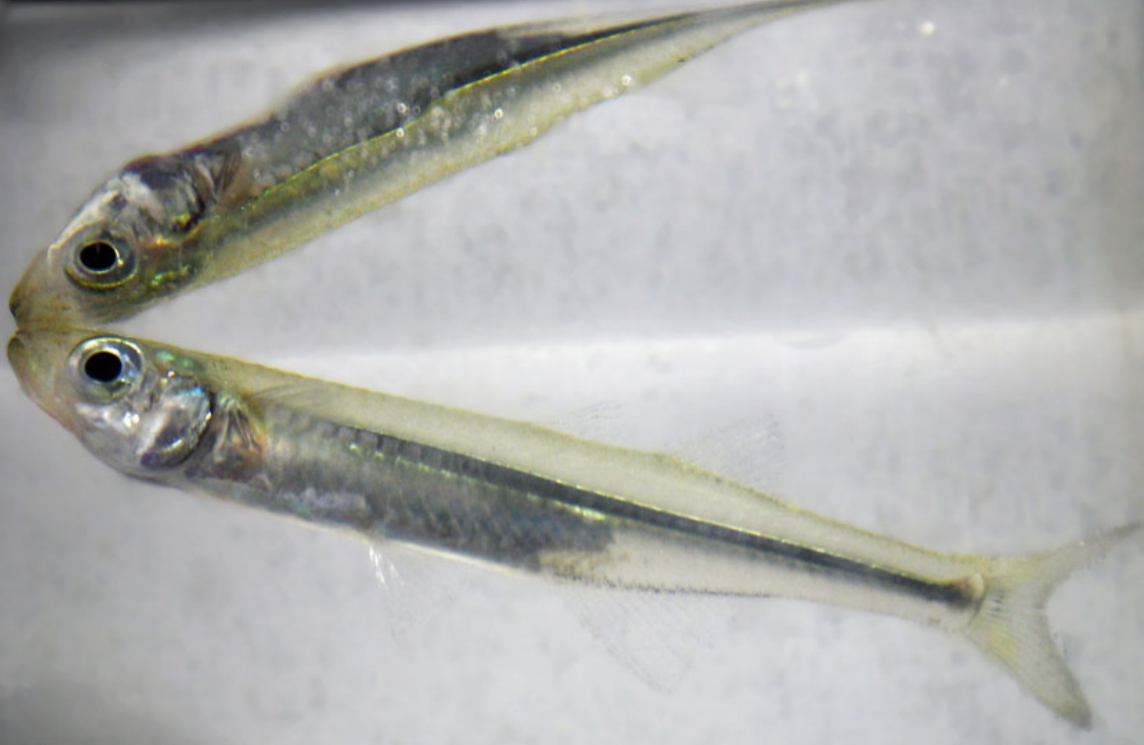
Hypoxia and ocean acidification are increasingly common in estuaries around the world, and are often caused by human activities that increase the amount of nutrients in estuaries (like fertilizer run-off and leaky septic systems). Much of the research team’s recent work has focused on understanding how the interactions of hypoxia and ocean acidification affect small fish know as silversides, which are an important part of estuarine ecosystems. Silversides are forage fish, which means that lots of bigger animals, like striped bass, egrets, and blue crabs, feed on them.
To look at the impacts of hypoxia and ocean acidification on silversides, the researchers and volunteer scientists exposed the fish to a range of dissolved oxygen and pH levels. In each treatment, they measured how quickly the fish’s gill flaps opened and closed, how often the fish came to the surface to breathe (called aquatic surface respiration), and how many of the fish died (mortality). In treatments that combined hypoxia and low pH, fish came to the surface to breathe more often and experienced higher mortality than in treatments where the fish experienced just hypoxia (even when the dissolved oxygen concentrations were the same). The research team also noticed that the fish experiencing both low oxygen and low pH opened and closed their gill flaps less often than the fish that experienced just low dissolved oxygen, which may explain why the fish that experienced both were more likely to breathe at the surface and more likely to die. It will take more research to really understand how those behaviors are connected.

THE CHESAPEAKE BAY PARASITE PROJECT

Volunteers working at Broomes Island in June. Photo by Monaca Noble.

Sometimes we find things other than mud crabs in the traps! These are eggs (probably fish eggs). Photo by Monaca Noble.

We also find skillet fish in oyster traps. Photo by Monaca Noble.

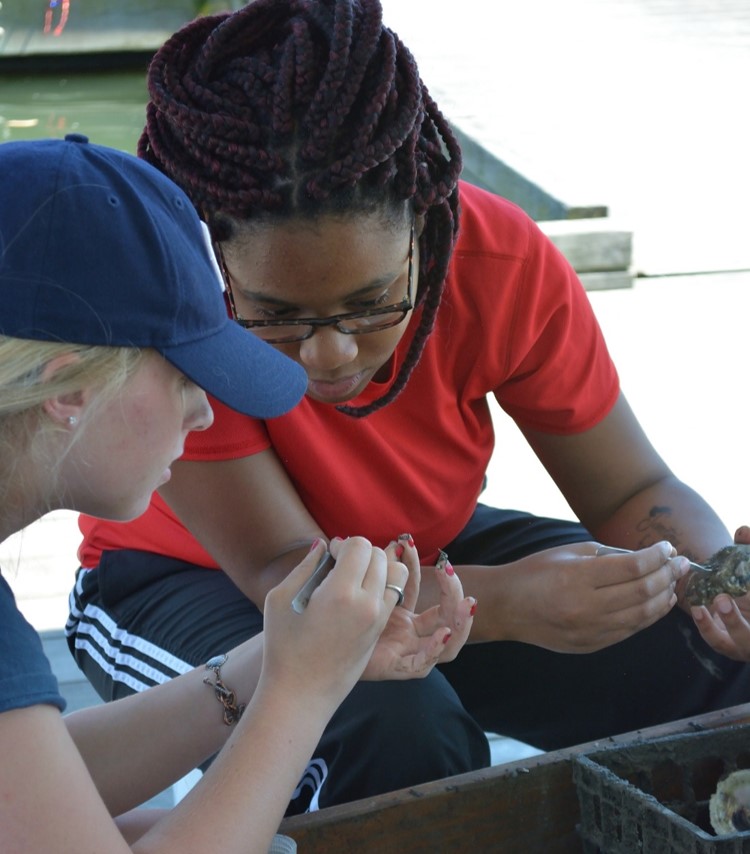
Volunteer scientist Gee Gee Lang helps staff sort fish on the dock. Gee Gee also worked in the lab helping researchers measure and sex crabs!

Volunteer scientist Eileen Cover works with researchers in the lab.

Volunteers look for crabs.

Sometimes weather isn't on our side! The volunteers were warm and dry under the covered dock, but our staff got a little wet.

We hope you can join us in 2017!


As part of the Chesapeake Bay Parasite Project, researchers and volunteer scientists in the Marine Invasions Lab track population changes of white-fingered mud crabs in Chesapeake Bay. These small (usually less than 1 inch across) crabs are very common throughout the Bay, and provide an important source of food to larger animals like fish, birds, and blue crabs. In many parts of the Bay, white-fingered mud crabs are infected by an invasive parasite called Loxothylacus panopaei (they don’t have a common name, so we just call them Loxo for short). Loxo are barnacles, although they don’t look or act anything like the barnacles that grow on docks and shorelines. When the Loxo are still swimming as larvae, they infect the mud crabs, and take over the crab’s nervous system – essentially turning the crab into a zombie! The parasite changes the infected crab’s anatomy and behavior, and forces the crab to care for developing parasite eggs and larvae!
This year, volunteers collected crabs from five estuaries in Chesapeake Bay. At each site, they removed crabs from collectors that had been placed in the water two months before. Lab volunteers are still working to determine the size and sex of each collected crab, as well as to determine if the crab had been infected by parasites. This information will allow the research team to look at the overall white-fingered mud crab population at each location, as well as determine the parasite prevalence (the percentage of crabs that have been parasitized). In June 2016, the team found a relatively high parasite prevalence compared to previous sampling years. We aren’t sure why this happened, but researchers and interns have been conducting laboratory studies to better understand how the crabs and the parasite respond to environmental changes like temperature and salinity, which may provide some insight.
In 2017, the team plans to continue the summer crab collections. Additionally, they are going to do more frequent collections from a few sites near SERC to look at population changes throughout the year, and will be collecting plankton samples from the water to learn more about populations of juvenile mud crabs.
To learn more about the Chesapeake Bay Parasite Project, check out their annual newsletter!
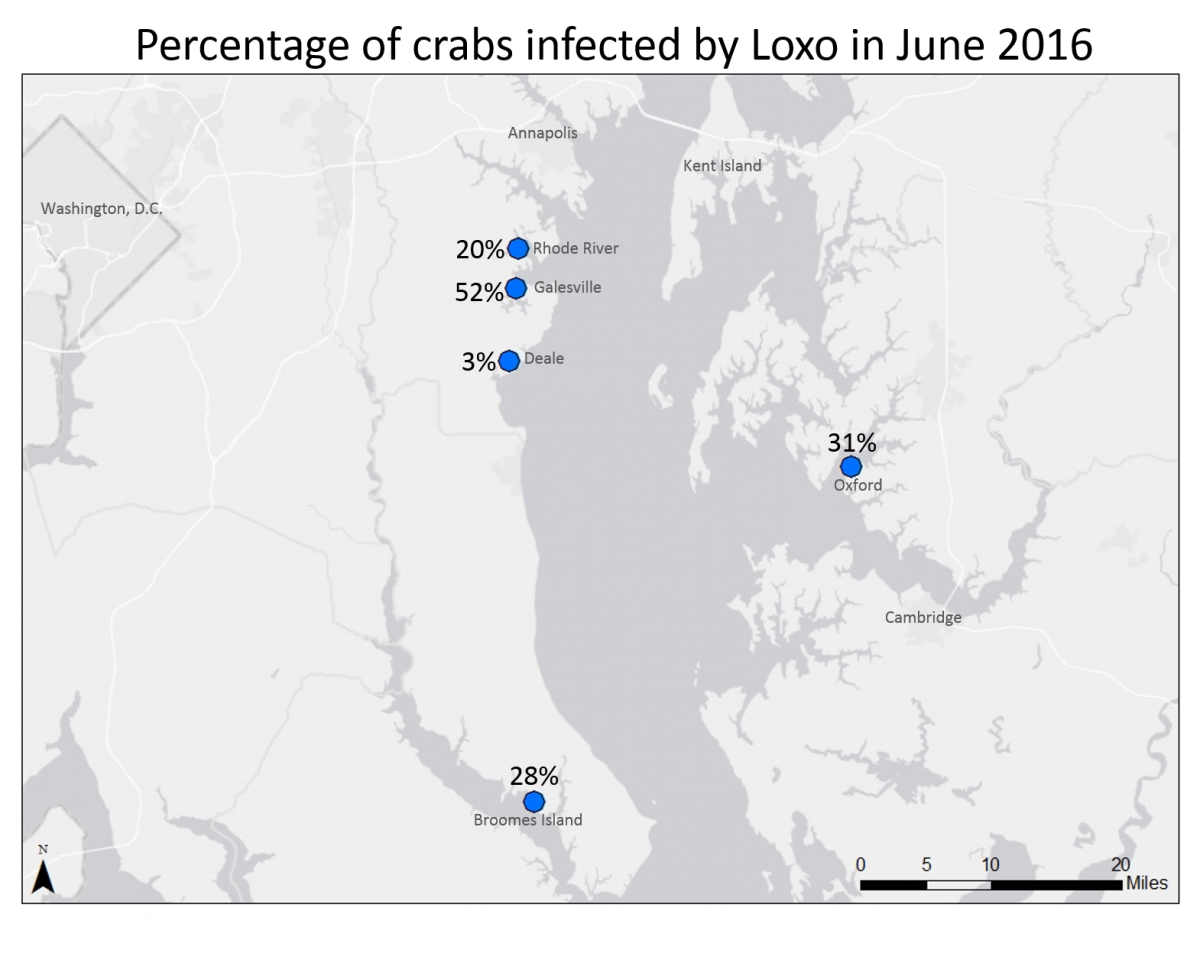
PLATE WATCH

The Marine Invasions Lab researchers have been working with volunteers to track the movement of non-native marine invertebrates along the West Coast of the US and Canada. Volunteer scientists deploy settlement plates—small PVC tiles that are zip tied to bricks to keep them underwater. They also collect environmental data, such as water temperature. After the plates have been in the water for three months, volunteers pull them up, photograph them, and let us know if they see any of our target non-native. This very rich data set provides information about new and established invasive species, native species, and how species respond to environmental changes. You can learn more about the project and read the Plate Watch 2016 newsletter here.
The research team is most interested in specific, target species (usually those that are new to an area), but they also want to monitor populations of existing invasive species. By collecting information about new and established invasions, we can determine if populations are growing or shrinking in certain regions. This information can tell us what effects these invasive species may have in their introduced environment. Many of the target species can grow quickly, covering large areas, smothering native species, and damaging man-made structures such as docks, boats, and cables in the water. By knowing when these species arrive in a new location, we have a better chance of preventing or managing their impacts.
The Plate Watch team would like to extend a warm thank you to all of the current monitoring groups. We’re hoping to make the experience even better for our volunteers by improving our website capabilities, creating the option to upload photos from a mobile device, and adding new study sites in 2017!

GREEN CRABS

The Marine Invasions Lab has been studying the introduction of the European Green Crab to the US for almost 15 years. There are reports of the European Green Crab on the East Coast of the US from almost 200 years ago, and the crab was first found on the West Coast in the 1980s in the San Francisco Bay area of California. SERC researchers based in Tiburon, California have been monitoring the spread of the crab and its impacts on the environment. European Green Crabs are considered an invasive species in the US. Not all introduced species are destructive (which is how we decide whether to call a species invasive or not), and some get along very well with their new neighbors. However, European Green Crabs are aggressive neighbors! They compete with native species for food and space, and eat species that are commercially important for humans, like soft shell clams.
Volunteer scientists began monitoring European Green Crabs in the San Francisco Bay area in 2009. Since then, SERC researchers have worked with residents, students, and teachers to help count, measure, and collect the crabs. The research team has learned a lot about the invasion, but we want to keep tracking the crabs to understand how well the population management strategies are working.
During a Discovery Day event at the Romberg Tiburon Center on San Francisco Bay, SERC researchers engaged visitors in a project to understand which methods are most effective for collecting data about European Green Crabs. Visitors, who ranged in age from middle school students to retirees, measured green crabs using either rulers or digital calipers. The SERC scientists measured the same crabs using the same tools, which allows us to compare how different groups of people use the two tools. While visitors got similar results to the scientists when using the calipers, the visitors’ measurements were less accurate when using the ruler. Many of the visitors’ ruler measurements clustered around half and whole values (like 5.5 cm and 6 cm), which we did not see when the scientists made measurements of the same crabs. This indicates that people with less experience making precise measurements may have more difficulty using the ruler for this task. This tell us that going forward, volunteers will likely provide more precise measurements with less training if they use calipers rather than rulers, so the investment in calipers (which are quite a bit more expensive than rulers) would be worthwhile.


We hope to work with more groups in 2017 to monitor Green Crabs!
OYSTER DRILL

This is what a drilled oyster looks like! Photo by Chela Zabin.

Looking for Oyster Drills. Photo by Courtney Calkins.

Sometimes oyster drills eat barnacles. Photo by Courtney Calkins.

Looking for oyster drills with a view of San Francisco. Photo by Courtney Calkins.


Scientists in the Marine Invasions Lab and a number of other institutions have been working to restore Olympia oyster populations in San Francisco Bay for over a decade. Oysters are important because they are filter feeders—this means that they eat small plankton and other particles in the water, and can improve water quality. However, some Olympia oyster restoration efforts in the San Francisco Bay have been complicated by a predator - an introduced snail called the Atlantic oyster drill. Atlantic oyster drills are native to the East Coast of the United States, and researchers understand them pretty well in their native habitat. However, we are still learning how they behave on the West Coast and how they interact with West Coast oyster species.
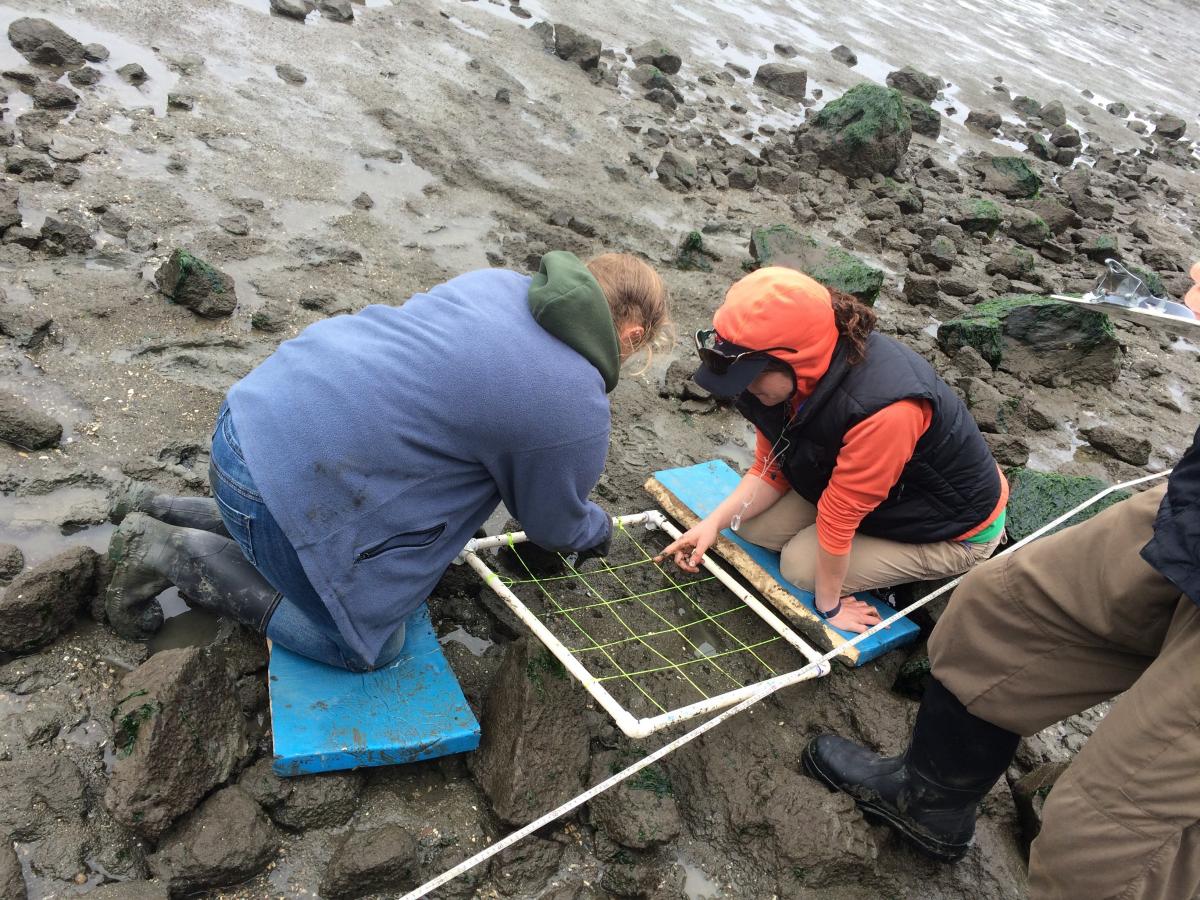
This year our researchers worked directly with volunteer scientists, including those from the Richardson Bay Audubon Center and Dominican University to determine how far oyster drills travel. This is important because by understanding the snails’ behavior, we can design better oyster restoration approaches by coming up with ways to keep the snails away from the oysters.The research team uses a grid made out of rope that can be laid out on the beach and over rocks to provide an easy visual reference for researchers and volunteer scientists to determine the precise locations of Atlantic oyster drills.
In 2017, researchers look forward to continuing this work with volunteers and partner organizations. They also plan to add new oyster drill studies, like determining how oyster drills respond to different water levels.

NEARSHORE SAMPLING

For 25 years, SERC’s Marine Invasions Lab, and the Fish and Invertebrate Ecology Lab, have been studying the interactions between different marine animals in the shallow coastal zones of the Chesapeake Bay. These shallow areas, called nearshore zones, provide important habitat, food, and nursery grounds for small crabs and fish. Throughout the year, researchers and volunteers conduct surveys to understand where grass shrimp, fish, crabs, and reptiles live and reproduce and how their populations are changing.
During the surveys, researchers and volunteer scientists collect data about the organisms that live in the nearshore habitat. The main way they do this is through nearshore seining. The research team stretches out a long net parallel to the shore, and uses it to collect all the organisms that are larger than 5 millimeters. The catch includes animals like blue crabs, fish, and even cownose rays! Scientists and volunteers have to work quickly and carefully to identify, measure, and release all animals safely back into the water.

The research team also looks at specific groups of organisms. A major focus is grass shrimp, small (approximately 1.5 inches long) shrimp that are common in nearshore habitats throughout Chesapeake Bay. They are a key part of the Bay’s food web and are often used as a bioindicator, or an organism that provides early warnings of environmental stress, in estuaries and coastal habitats. Scientists and volunteers catch the grass shrimp using dip nets, measure them, and check them for parasites. They use these data to track how the age distribution and overall abundance of grass shrimp change through time.
With help from volunteer scientists, we will be able to see how animals that live in nearshore zones change over time. The work can be labor intensive and difficult, but rewarding! Researchers and volunteers on this project admitted to using several non-traditional remedies for inevitable jellyfish stings during fieldwork— including meat tenderizer! There is an enzyme found in this common household product that is thought to break down the protein found in jellyfish venom and reduce swelling and itching. One researcher admitted to accidentally buying flavored meat tenderizer: “for the rest of the day, people were wondering where the barbeque smell was coming from!”
This work couldn’t get done without a dedicated team of researchers and volunteer scientists—thank you so much for your efforts! We look forward to working with you again next year.
PLANT ECOLOGY

Volunteers in the Plant Ecology Lab are involved in all of the day-to-day activities of the lab, but much of their efforts involve work for the North American Orchid Conservation Center (NAOCC). NAOCC is based at SERC and led by the Plant Ecology Lab. NAOCC scientists and volunteers throughout the US and Canada are working to understand and protect the more than 200 species of native orchids in North America (more than half of them are endangered or threatened), and educating the public about the native orchids near them. Volunteers help with this research by working with orchids in the lab and by working on the GoOrchids website, which contains educational information and outreach materials like Orchid-gami.
BIODIVERSITREE

Volunteers Kim, Kallan, and Reece Benson help pick insects off of trees.

Volunteer Steve Lonker helps take bulk density measurements.

Volunteer Vilma Sanchez helps researchers take tree height measurements.

Volunteers help collect bulk density measurements.

Volunteers collect bulk density samples from the BiodiversiTREE plots.


In 2013, the Terrestrial Ecology Lab began a large-scale forest biodiversity experiment, called BiodiversiTREE. Lab staff and volunteers planted more than 20,000 tree saplings (enough to cover an entire sub-watershed), starting a 100 year experiment to understand the role of biodiversity in the growth and health of temperate forests. Because of the large scale of the project, volunteers have been instrumental in helping us get things up and running, and beginning to collect lots of data!
This year volunteer scientists measured tree height and survival, collected insects, and took soil samples. Because trees grow slowly and forests take a long time to develop, we are still in the early stages of collecting all of the different types of data about them and the forest that they are forming. However, we have started analyzing data about their habitat - in this case, by analyzing the soil that they are growing in. By better understanding the soil and other habitat characteristics, we hope that we will have enough background information to accurately interpret the data that we collect about the trees.
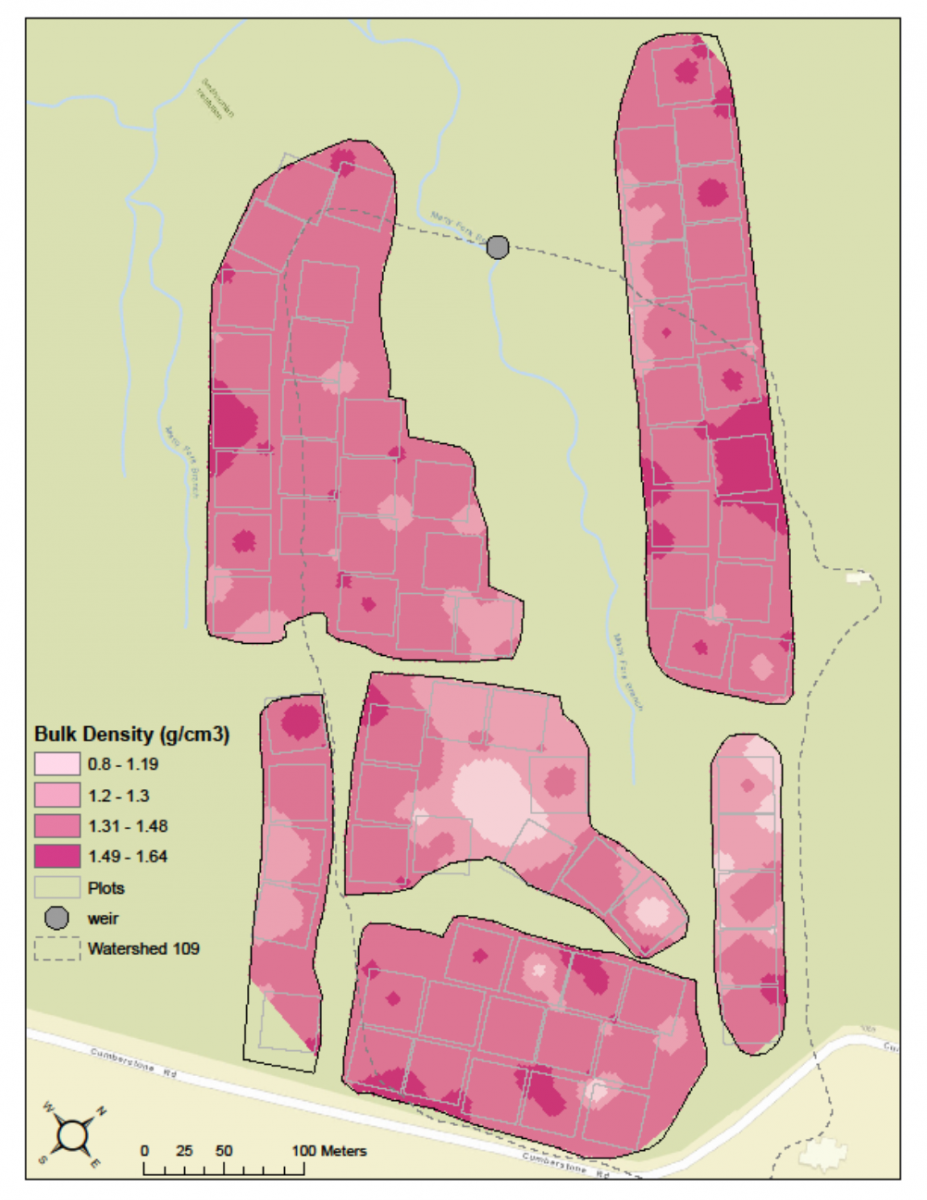
One of the most interesting kinds of habitat data that BiodiversiTREE volunteer scientists collected this year was bulk density soil samples. Volunteers collected soil samples of identical sizes from each plot of trees in the BiodiversiTREE experimental forest, and then took the samples back to the lab where they were dried and weighed. This information provides a measurement of soil bulk density, which tells you much soil is in a given volume. If bulk density is high, that means there is a lot of soil in a given volume. This means the soil is more compacted, which is often a result of agricultural activity. The higher the bulk density (and the more compacted the soil is), the harder it is for roots and small insects and worms to move through the soil. The BiodiversiTREE forest is located in a former cornfield, so a lot of the soil has been compacted by repeated plowing. Compacted soil can be problematic for young trees because root growth is restricted, which means the plants cannot get the water and nutrients they need from the soil around them.
Next year we plan to work with volunteer scientists to continue taking tree and habitat measurements. We hope you can join us!
MANGROVES

Volunteer scientists help researchers measure plant fluorescence

Volunteer scientists help researchers measure how much plants breathe. The white coating on the leaves is salt!

This fall volunteer scientists helped our researchers replant mangroves for a new experiment.

Join us in 2017!


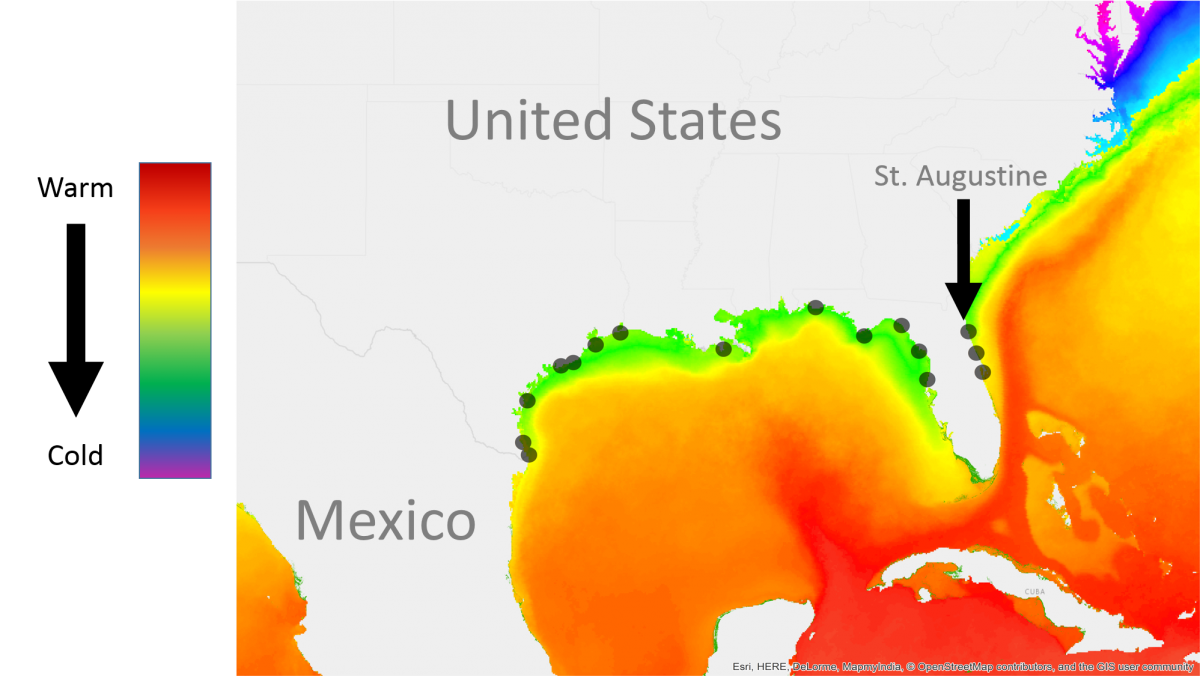
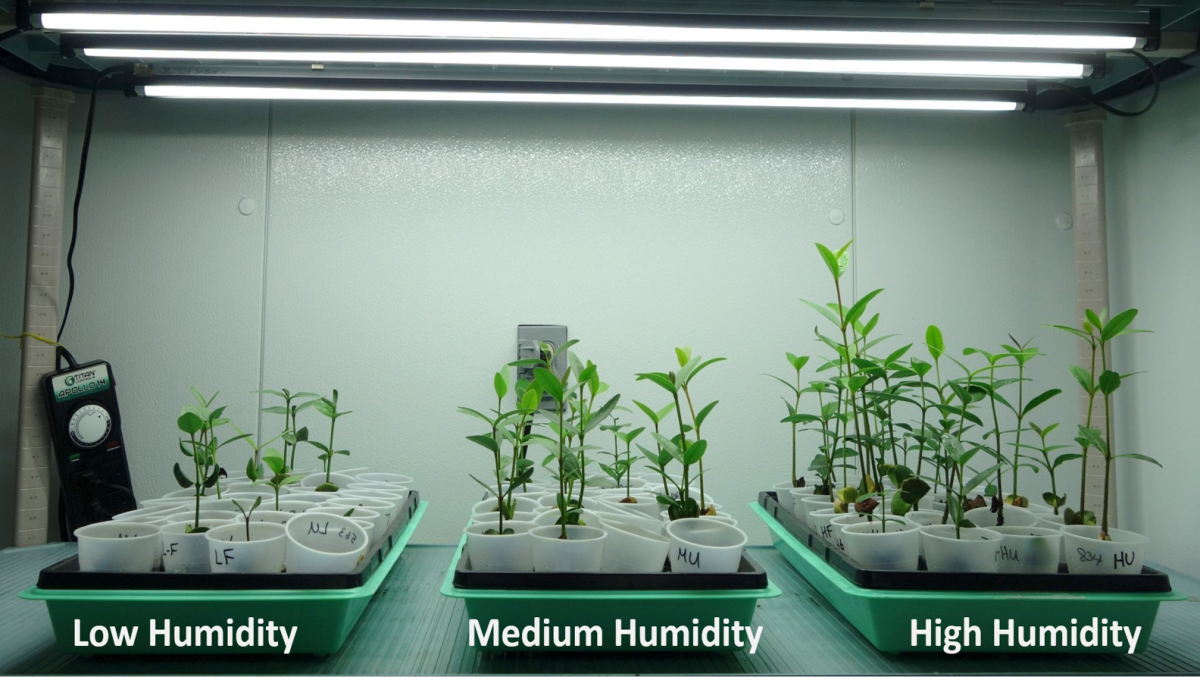
The Terrestrial Ecology Lab and Animal-Plant Interactions Lab are studying the effects of a changing climate on mangrove distribution in North America. Mangroves are trees that live along shorelines in tropical regions. They are important because they provide habitat for other plants and animals and they protect our coasts from things like storm surges. As global temperatures rise, the mangroves are "marching” northward into places they haven’t been found before. Scientists and volunteers at SERC have been studying how colder winter temperatures and decreased humidity could affect mangroves in these new habitats. In one experiment, almost 2,500 mangroves were harvested from sites in Florida, Louisiana, and Texas and then grown in chambers in our lab at SERC. Researchers and volunteer scientists then manipulated temperature and humidity levels in the chambers to learn how lowering temperature and humidity would affect plant growth. Volunteers helped scientists care for the plants by checking humidity, and keeping the plants hydrated with salt water.
In order to determine how the plants respond to stress, scientists expose them to conditions (like temperatures) beyond what they usually experience in nature. Plant stress can be measured in several ways. One way is by looking at chlorophyll content of leaves. Chlorophyll is what helps the plant photosynthesize, and convert light to energy (and oxygen). The less chlorophyll a plant has, the more stressed it is. In addition to the amount of chlorophyll, scientists can also measure chlorophyll fluorescence—how much light is re-emitted by leaves during photosynthesis. This gives them information about how much energy the plant is absorbing.
Researchers and volunteers also measured plant stress by measuring how much the leaves breathe. Leaves breathe by opening tiny pores (stomates) under their leaves, and taking in carbon dioxide. However, when stomates are open and the plant is “breathing”, the plant also loses water. Researchers found that plants in drier, colder conditions did not grow as tall as plants in more humid, warmer conditions, because they had to close their stomates to avoid excessive water loss.
Finally, researchers monitored how mangroves would react to a prolonged period of cold temperatures and a cold snap. The prolonged period of cooler temperatures simulated the kind of winter temperatures some of Florida regularly experiences. The cold snap simulated the extreme freeze events that mangroves may experience only a couple of times every winter, and usually result in a lot of dead plants in the relatively warm climate of Florida. Scientists wanted to see how rapid changes in temperature and slow, steady changes in temperature affect mangrove growth and survival. The answer depends on the species! In general, researchers found that black mangroves, which grow closer to coastal areas, are more resistant to both cold snaps and prolonged periods of cold temperatures. Red mangroves, which grow further out in the intertidal zone, were initially more sensitive to chilling and freezing but were able to recover from the prolonged period of cold temperatures in some cases.
This fall, researchers started working on a new experiment to study mangroves from Panama, Florida, and Baja California. They will continue to study how plants in these areas adapt to cooler temperatures to get an idea of how far north mangroves can spread. This experiment is in its first stages, but we are excited to involve more volunteer scientists in 2017!
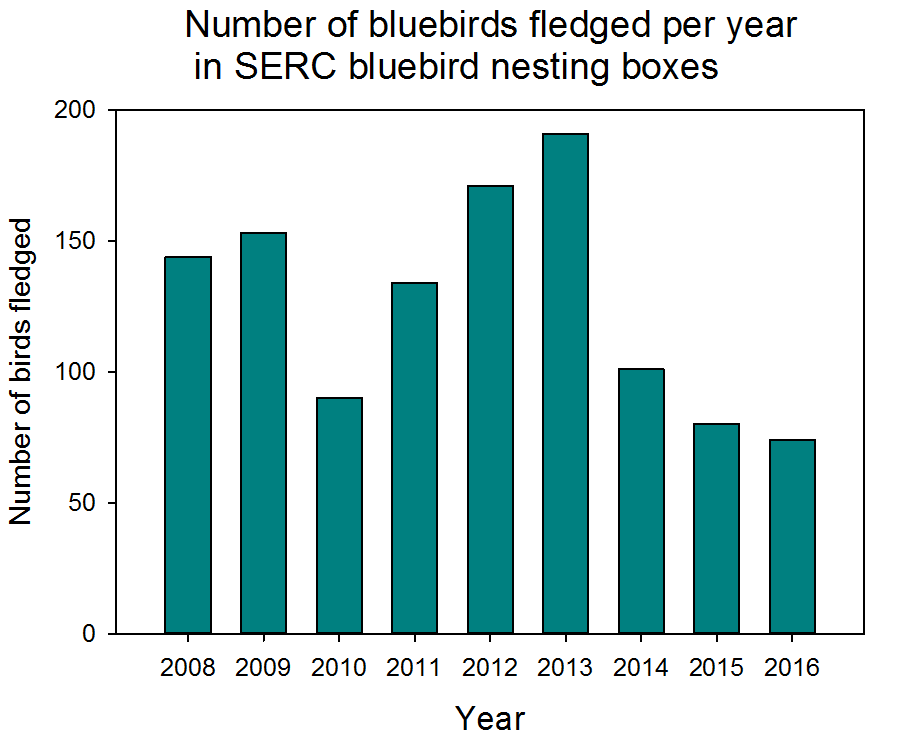
BLUEBIRDS

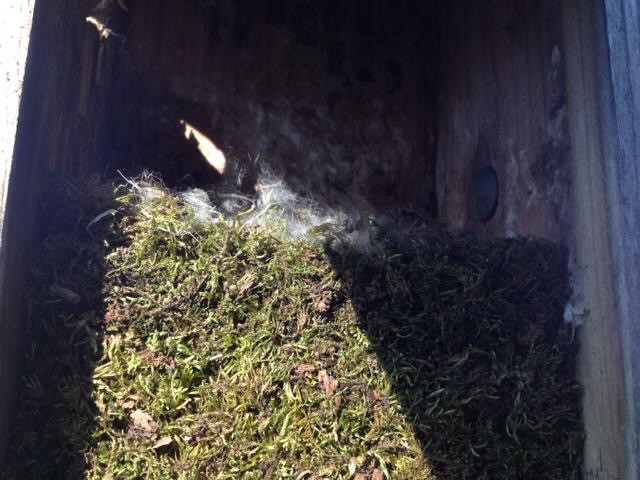
Bluebirds are desirable to farmers because they help control insect populations. However, in the late 20th century, bluebird populations along the east coast of North America crashed. In an effort to restore bluebird populations, conservationists and bird lovers encouraged the development of bluebird trails, areas where bluebird nesting boxes are set up and monitored regularly. At SERC, volunteer scientists walk the Bluebird Trail once a week during the spring and summer to collect data from 48 nest boxes. We share the data with ornithological groups, like the North American Bluebird Society, and the data can be used by researchers to track bluebird populations along the East Coast.
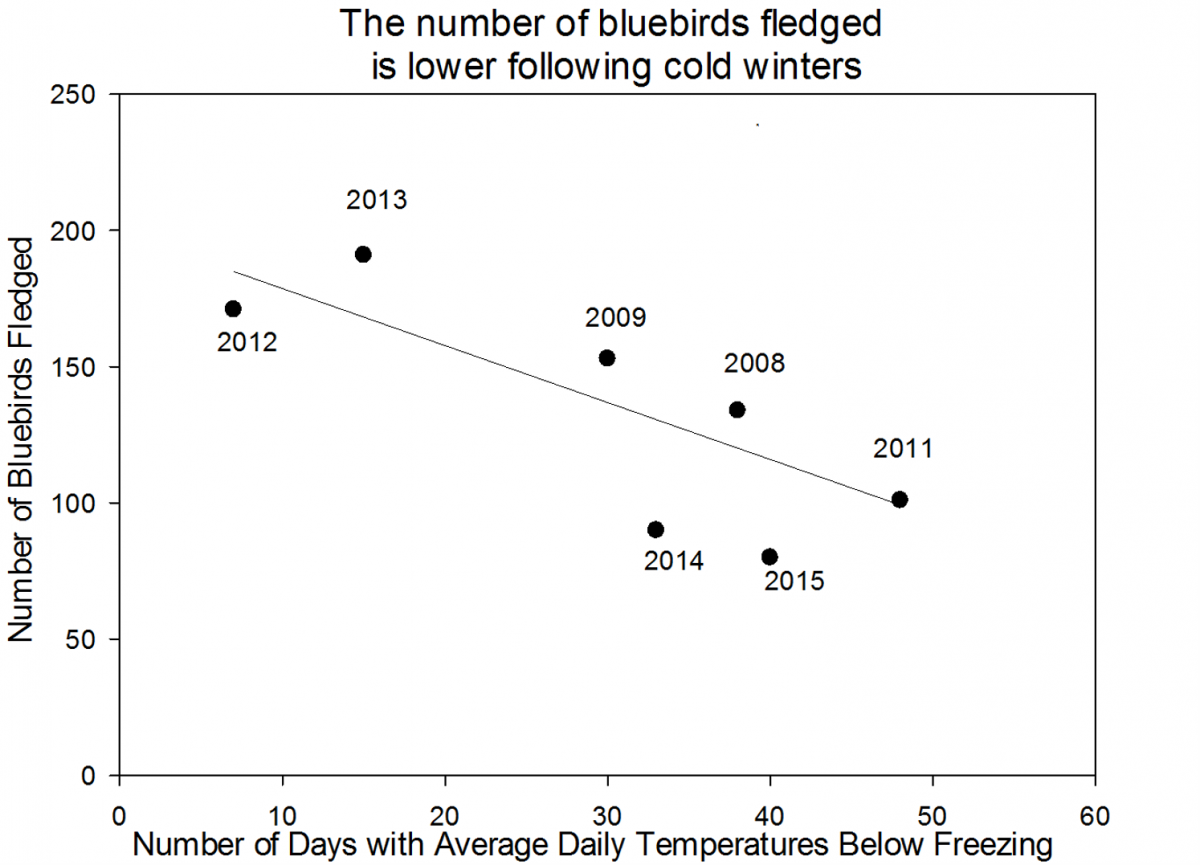
This year our volunteer scientists saw a decrease in the number of birds fledged (meaning that the bird survived and matured enough to leave the nest) from 80 fledglings in 2015 to 74 fledglings in 2016. An analysis of the data up through 2015 suggests that the number of birds fledged relates to the number of days below freezing in the previous winter. This could be because with more very cold days during the winter, adult bluebirds have a harder time finding food and aren’t as fit when the nesting season starts. We are interested to see if the pattern holds up and helps to explain the 2016 data or if we need to explore alternate hypotheses.
Volunteers have been monitoring blue birds on SERC’s Bluebird Trail for nine years now! This is a completely volunteer-run project, and we are so lucky to work with people who are committed to bluebird conservation! Project volunteer scientist Ann Johnson perfectly expresses the commitment and enthusiasm that our volunteers bring to the project: “As a lifelong birder, this project has brought immense personal joy…I always envied those folks on documentaries who actually got to witness the secret life of birds, and now I’m one of them!”