

May 6, 2013
The introduction of marine species is a global problem that is a major force of change across all habitats. Introduced species compete with and consume native species and they can result in economic damage to fisheries, aquaculture, and in some cases industries along the water (for example zebra mussels clogging water intake pipes). But nonnative species are not evenly distributed. Some bays have relatively few introduced species while others have very large numbers. San Francisco Bay, for example, has more than 200 reported nonnative species, twice the number of any other bay in the US.
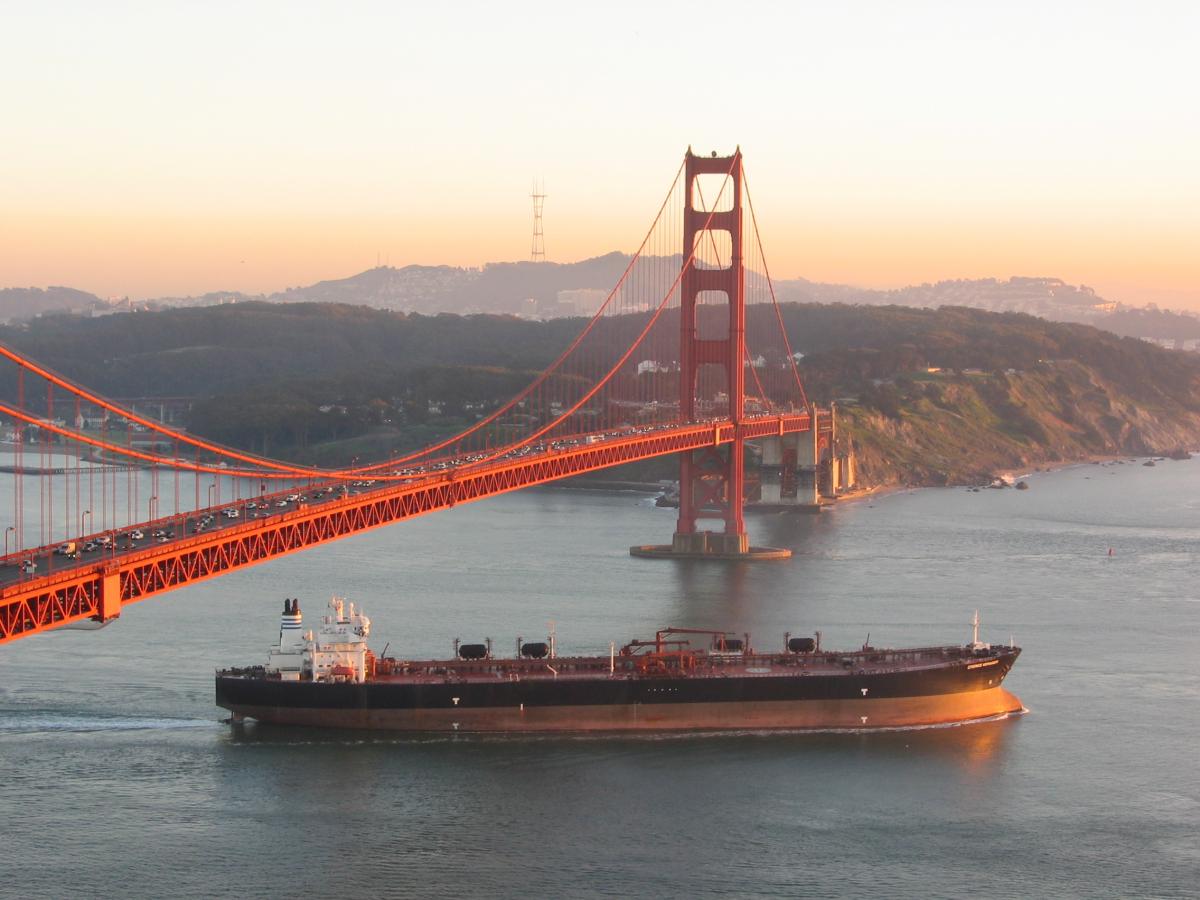
The way that species are introduced also varies and often there are multiple means of introduction (vectors). Prevailing vectors include intentional introductions (fisheries) and accidental introductions through shipping, aquaculture (oysters), and the seafood and bait trades. But while there are many vectors, shipping stands out as the primary method of introduction for many marine and estuarine invertebrates and algae. Shipping includes both ballast water* and hull fouling*.
With shipping being such an important vector, a group of researchers from the Smithsonian Environmental Research Center’s Marine Invasions Lab led by Dr. Gregory Ruiz, wanted to understand the relationship between ship traffic and the number of introduced species. Their research was published in Ecological Applications in 2013.
Do bays with large numbers of vessels also have large numbers of introduced species?
Dr. Ruiz’s team selected 16 bays, 4 on the Gulf Coast, 6 on the Atlantic Coast, and 6 on the Pacific Coast. For each bay they documented the number of nonnative species that have established populations and recorded the date of first record for each species. Next they collected data from the National Ballast Information Clearinghouse on the number of ship arrivals and the amount of ballast water discharged in each bay over a two year period from 2005 to 2007.
In order to assess whether there was a relationship between the number of species introduced and the shipping data collected, they first made some adjustments to make sure that what was being compared was both reasonable and standardized across all the bays. The first adjustment was one of scale. Comparing data collected over a long period (hundreds of years of introduction) to data from a very short period (three years) can be problematic. But with detailed shipping information limited, the team decided that the shipping data could only be used as a proxy for historical shipping patterns for 25 years, and thus only compared these data with species introduced within a 25 year window (1982-2007).
The second adjustment was salinity. Not all of the 16 bays have low salinity brackish water. In order to compare nonnative species found in habitats available in all bays, they limited their analysis to only species found in high salinity environments.
The third adjustment concerned the means of introduction (vector). As mentioned earlier, there are several vectors in addition to shipping including bait, seafood, the aquaria industry, and stocking, but one vector stands out – the oyster trade. From the 1870s to the 1930s large quantities of oysters from the East Coast were transported to the West Coast for aquaculture. Starting in the 1930s, Japanese oysters were brought from Asia for aquaculture, and they remain an important commercial species today. Oyster transport moved entire communities and soon the organisms found in and around oyster reefs in Chesapeake Bay, Long Island Sound, and Japan were found in bays on the west coast. Since oyster transport is predominately a historic and west coast vector it was excluded from the analysis.
With this new dataset, the team compared the number of high salinity species that had been introduced within the last 25 years for which shipping was a vector (excluding those from the oyster trade). When they limited the data in this way, they found that there wasn’t nearly as much variability between bays as it first appeared. In fact, San Francisco Bay had only a few more species than other bays on the west coast.
So even though shipping is the dominant vector for marine invasions, simply looking at the number of ship arrivals or the volume of water discharged cannot explain the number species in a given bay. The movement of species is complicated and we must look at the collective impact of many vectors and the unique history of each bay in order to determine why and how species have been, and are continuing to be, introduced.
Reference
Ruiz, Gregory M., Paul W. Fofonoff, Gail Ashton, Mark S. Minton, and A. Whitman Miller. 2013. Geographic variation in marine invasions among large estuaries: effects of ships and time. Ecological Applications 23:311–320. (contact us for the pdf)
*Glossary
| Term | Definition |
| Ballast Water | Ballast water is carried by ships to provide balance, stability, and trim during sailing and to keep them upright during loading and offloading operations. Ballast water is typically held in dedicated ballast tanks located around cargo holds and near the bow and stern of the ship. |
| Hull Fouling | Organisms like barnacles, mussels, sponges, algae and sea squirts attach themselves to the hulls of ships, fouling them. These organisms then colonize the hull and "hitch a ride" from one port to the next. Invasions can occur when these fouling organisms release their larvae into its waters adjacent to structures in a new port. Under the right conditions, these invaders may establish themselves in the new port and spread to nearby areas within that region. |