Methods
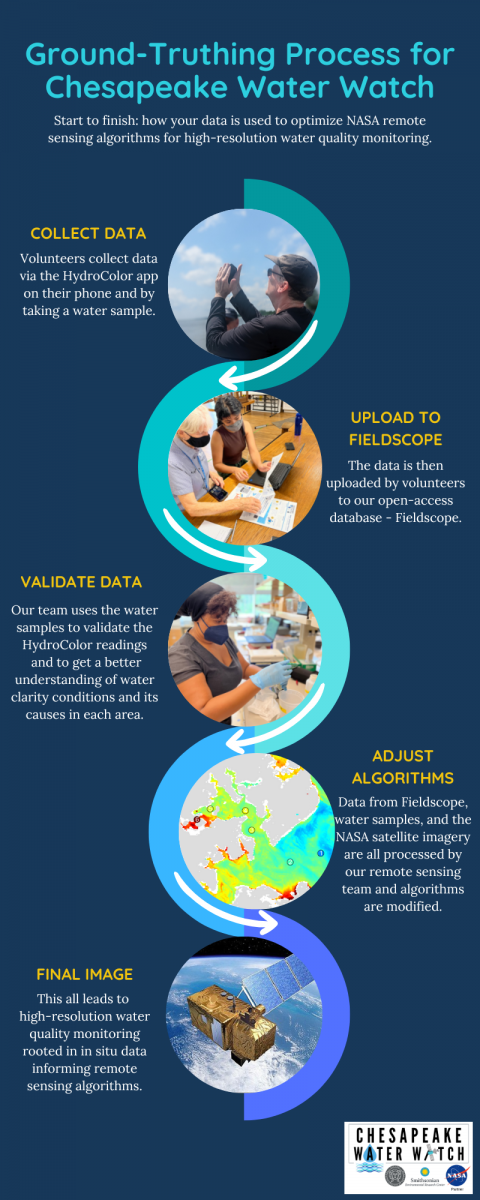
The scientific process that the Chesapeake Water Watch project uses is called "ground truthing". As its name suggests, what we are doing is taking data here on the ground to correct and validate the data that satellites are reporting. By taking data on the ground and cross-referencing it with the information provided by the satellites, we are able to essentially "train" the satellites on how to analyze water quality conditions in the Chesapeake Bay. There are three "tiers" of data collection to get involved with. Volunteers can choose from any combination of these tiers and how involved they would like to be with the project! We recommend that data is collected on a day when a satellite is passing over, you can find the Google calendar for satellite flyovers here or at the bottom of this page.
Data Collection
Tier 1 - HydroColor Data
The first level of data collection uses the free, smartphone app - HydroColor. HydroColor requires volunteers to go at least 100 feet from the shoreline and take 3 pictures within the app. The first picture is of a gray card to calibrate the app, the second is a photo of the sky, and the third picture is a picture of the water. The app reads the reflectance of all 3 of the photos and gives a turbidity (or water clarity) reading. That turbidity number is then uploaded to our open-access database Fieldscope where our researchers (and the public!) can access the water quality data from different volunteers around the Bay.
Tier 2 - HydroColor + Small Water Samples
The second level of data collection for the Chesapeake Water Watch project includes taking HydroColor data on a smartphone as well as taking small water samples (about half the size of a water bottle). This water sample is processed back in the lab with small, easy-to-use machines that analyze turbidity (water clarity), color-dissolved organic matter (CDOM), and in vivo chlorophyll (indicator of "plant-like" material/algae in the water). Volunteers even have the opportunity to come in to our lab and process the water samples that they collected themselves before uploading their data to Fieldscope.
Tier 3 - HydroColor + Large Water Samples
The third level of data collection includes taking HydroColor data as well as large water samples (the size of a 12 fl oz water bottle or more). This water sample is processed on the smaller machines in the lab as well as processed by our staff on more advanced machines known as a spectrophotometer and a fluorometer. While volunteers are welcome to process water samples on the smaller machines in the lab, we cannot have volunteers using the spectrophotometer and fluorometer without prior experience with the machines and proper training.
Data Analysis
After the data is collected and reported to Fieldscope, our remote sensing team analyzes the information from the satellite data and cross-references the data collected by our volunteers. The satellite algorithms are adjusted based on the actual data from the Bay.
Satellite Calendar
Data collected any day is useful, but there are certain days when one, or both, of the satellites we work with are passing over the bay. By collecting data on these days, your sample goes the extra mile! Refer to the calendar below to see when each satellite is passing over the bay.

