Coastal Carbon Network
Building a Collaborative Network for Coastal Carbon Cycle Synthesis
Tidal marshes, mangrove swamps, and seagrass meadows are unique ecosystems found on coastlines worldwide. These wetlands support specialized plant, microbe and animal species that collectively form some of the Earth’s most productive ecosystems, influencing the ecology of estuaries and coastal oceans. Coastal wetlands are also under severe pressure from human activity which threatens to diminish the many benefits they provide to people and aquatic food webs. Among these benefits is the fact that they remove large amounts of the greenhouse gas carbon dioxide from the atmosphere and bury it in soils for centuries to millennia. Indeed, these ecosystems account for nearly 50% of the organic carbon buried in the oceans despite occupying less than 1% of ocean area. This surprising fact suggests an opportunity: that protecting, restoring and managing these ecosystems could help manage greenhouse gas concentrations in addition to the list of other ecological and social benefits they provide. The pace of research on this topic has accelerated and is now too rapid to be synthesized by individual investigators.
The Coastal Carbon Network (CCN) is a consortium of biogeochemists, ecologists, pedologists, and coastal land managers with the goal of accelerating the pace of discovery in coastal wetland carbon science by providing our community with access to data, analysis tools, and synthesis opportunities. Our Network seeks to catalyze scientific discovery, advance science-informed policy, and improve coastal ecosystem management by: (1) developing a community dedicated to coastal wetland carbon science for basic research, policy development, and management, (2) exploring the ecological links between coastal wetlands, estuaries, and the atmosphere, and (3) sharing data and analysis tools that support the diverse needs of scientists, policy makers and managers. We accomplish this goal by growing iteratively with community feedback, facilitating the sharing of open data and analysis products, offering training in data management and analytics, and leading topical working groups aimed at quantitatively reducing uncertainty in coastal greenhouse gas emissions and storage.
Coastal Carbon Network News
Browse CCN Products
Coastal Carbon Atlas
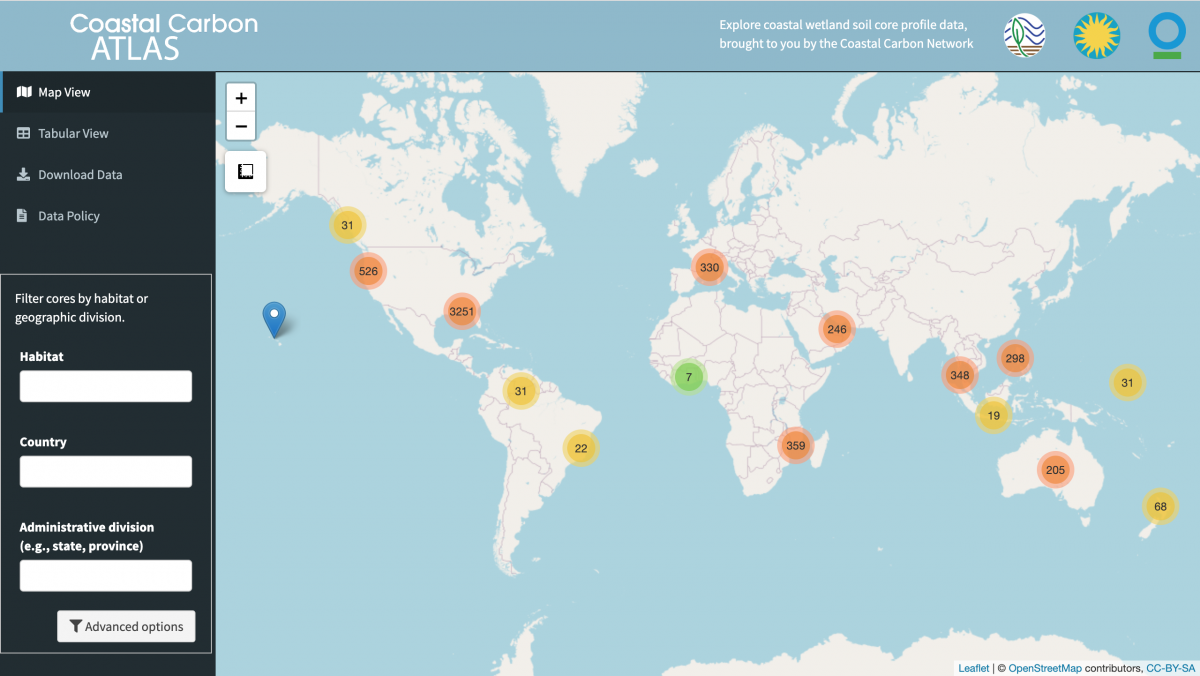
The Coastal Carbon Atlas is an interactive web application developed and maintained by the CCN to promote the exploration, query, and download of data from tidal wetlands around the world.
Blue Carbon Data Inventory
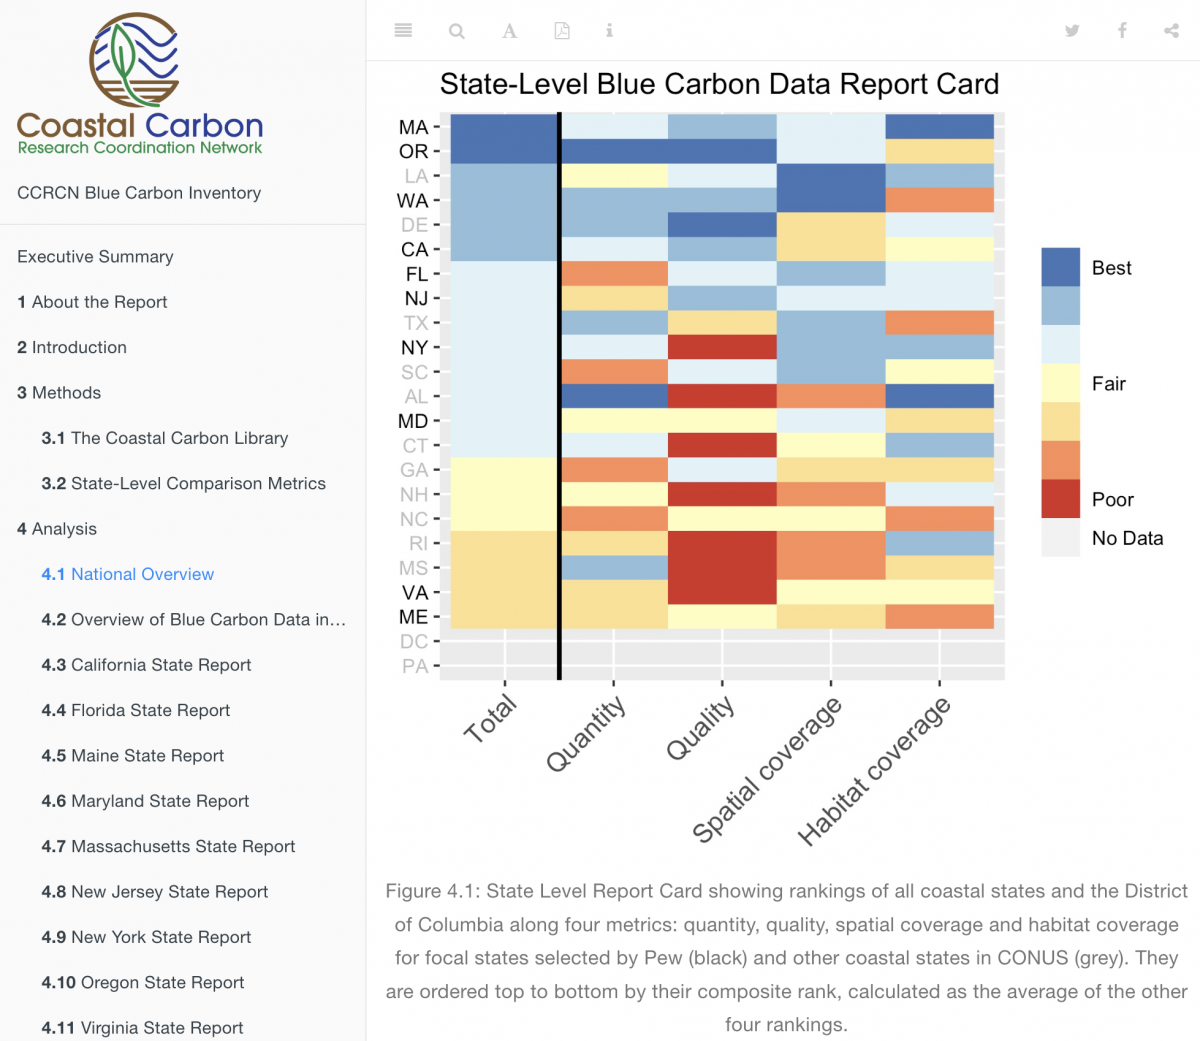
The CCN collaborated with Pew Charitable Trusts to produce a report on the state of blue carbon data in the contiguous United States. In this first-ever inventory of our database, we assess the quantity, quality, and representativeness of soil core data on a state-by-state basis.
People
Coastal Carbon Network Team
Alumni
Henry Betts
Former Research Technician
People
Call for CCRCN Steering Commitee Member Nominations
The Coastal Carbon Research Coordination Network Now Accepting Nominations for our Steering Committee
The Coastal Carbon Research Coordination Network (CCRCN) is seeking nominations for three new members on our steering committee. The CCRCN is an NSF-funded 5-year project hosted at Smithsonian Environmental Research Center with the goal of accelerating the pace of discovery in coastal carbon science. We do this by serving a diverse user base of scientists and practitioners with synthetic data, workshops, and open source modeling tools. Learn more about our project here.
Steering committee membership is a volunteer position and is essential to CCRCN governance. There are myriad benefits for participation. Steering committee members advise CCRCN administrators and personnel on critical programs and initiatives, direct and participate in collaborative research, and the CCRCN recognizes steering committee institutions as partner organizations. This is an opportunity to take a substantial leadership role within the coastal carbon community. Committee membership is a one-year tenure minimum with potential to extend or expand into other CCRCN leadership roles.
-
Attend a 1-hour monthly teleconference
-
Attend an annual Town Hall at the American Geophysical Union Fall Meeting
-
Contribute towards shaping the goals and timelines of CCRCN products
-
Give regular constructive feedback to CCRCN personnel to improve project implementation and governance
-
Network to identify potential new sources of funds or collaboration
-
Vote on major decisions such as changes to the CCRCN governance structure
-
Assist in the leadership and implementation of topical working groups
-
Write grants or raise other funds to further CCRCN goals
-
Speak on behalf of the CCRCN at meetings and conferences
We hope to address specific project needs with these new additions, but emphasize that we will take all nominees into consideration.
If you would like nominate yourself or a colleague please email CoastalCarbon@si.edu by December 1st. If nominating yourself please include a C.V. and a brief statement (no more than 300 words) indicating: 1. Your ability to execute the duties of an CCRCN steering committee member, 2. Any additional duties you would be willing to integrate into your CCRCN service, 3. How your participation would meet stated CCRCN needs, 4. Any ideas you have for pushing the CCRCN forward into 2019 and beyond.
The steering committee will meet to vote on nominations in December of 2019 and we will announce new members at our AGU Town Hall on Thursday December 13th.
Please email us at CoastalCarbon@si.edu if you have any inquiries regarding the priorities and initiatives of the CCRCN.
More about the CCRCN Steering Committee
The CCRCN is hosed at Smithsonian Environmental Research Center (SERC) staffed by two employees (James Holmquist, Manager; and David Klinges, Data Technician), supervised by two SERC principle investigators (J Patrick Megonigal, CCRCN Director, and Emmett Duffy), and advised remotely by five steering committee members (Lisamarie Windham-Myers, USGS; Kevin Kroeger, USGS; Jim Tang, MBL; Emily Pigeon, Conservation International; and Jorge Ramos, CI). Steering committee members serve for one year, but can be reappointed for one year at the discretion of the CCRCN Director. Candidates for the steering committee can nominate themselves or be nominated by their colleagues. The steering committee will vote on replacements, and members stepping down will help to choose their own replacement. Rotations are staggered so that no more than half of the rotating members on the Steering Committee are replaced in a given year. Learn more about CCRCN’s governance here and about current leadership here.
Research
Coastal Carbon Working Groups
The Coastal Carbon Network (CCN) actively coordinates and engages in topical working groups which seek to quantitatively improve the state of the science through expertise exchange, collaboration, tool development, and data sharing.
Learn more about our working groups below:
Methane Working Group
Methane Working Group
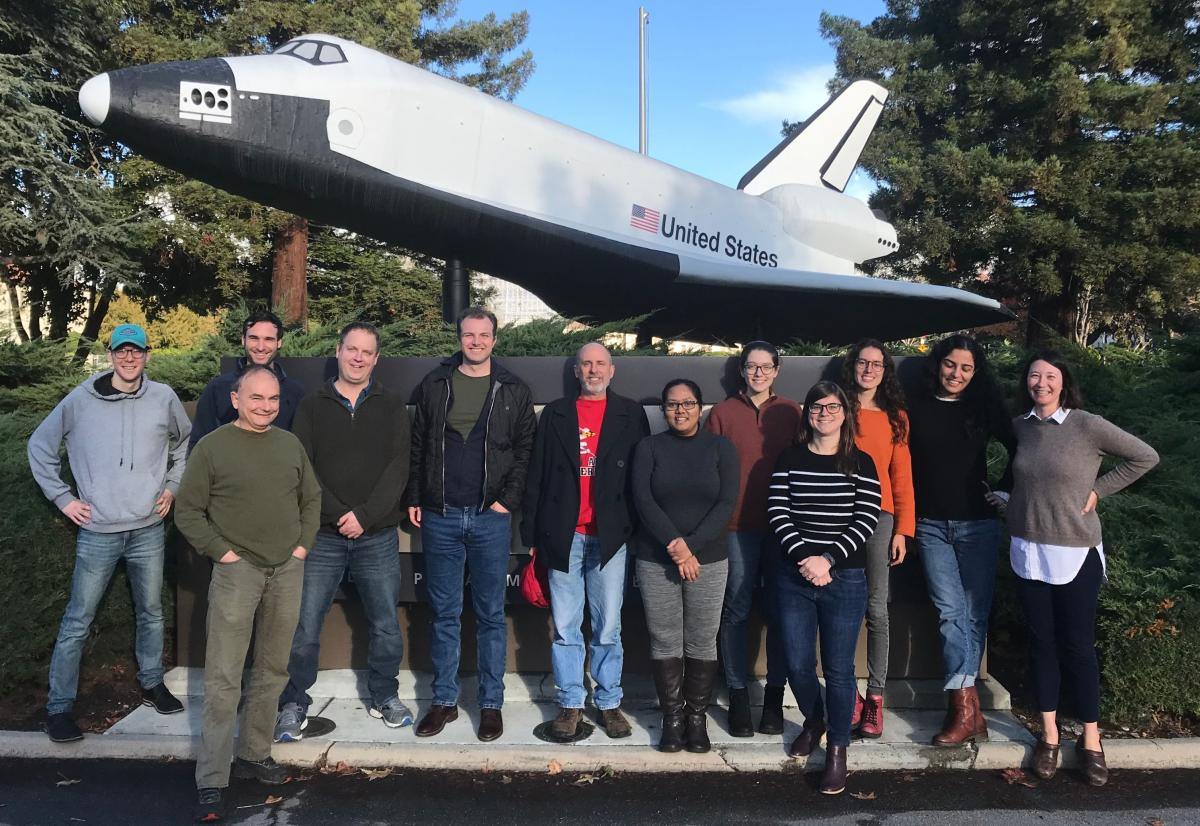
Time and Location: December 7 and 8, 2019, hosted at the NASA Ames Research Center, Moffett Field, California
Overarching goal of CH4 working group: Improve predictions of methane emissions from coastal wetlands. Specifically, we aim to compile all methane flux data from coastal habitats (not mangroves) in the CONUS to parameterize and validate a set of nested process-based CH4 models.
Research Questions
- How well can we predict methane emissions from coastal wetlands? In other words, what are the main sources of error? What types of wetlands are the most difficult to model (along spectrum of salinity, disturbance/age, plant community etc.)
- What data streams are needed to improve our predictions?
- Can our process-based models predict interannual variability? If not, why? How does this influence predictions of CH4 budgets in the future?
- What guidance can we give to the science and management communities based on these efforts?
Code of Conduct
The Coastal Carbon Research Coordination Network (CCRCN) is dedicated to providing a welcoming and supportive environment for all people, regardless of background or identity. However, we recognise that some groups in our community are subject to historical and ongoing discrimination, and may be vulnerable or disadvantaged. Membership in such a specific group can be on the basis of characteristics such as gender, sexual orientation, disability, physical appearance, body size, race, nationality, sex, colour, ethnic or social origin, pregnancy, citizenship, familial status, veteran status, genetic information, religion or belief, political or any other opinion, membership of a national minority, property, birth, age, or choice of text editor. We do not tolerate harassment of participants on the basis of these categories, or for any other reason.
Harassment is any form of behaviour intended to exclude, intimidate, or cause discomfort. Because we are a diverse community, we may have different ways of communicating and of understanding the intent behind actions. Therefore we have chosen to prohibit certain forms of behaviour in our community, regardless of intent. Prohibited harassing behaviour includes but is not limited to:
- Written or verbal comments which have the effect of excluding people on the basis of membership of a specific group listed above
- Causing someone to fear for their safety, such as through stalking, following, or intimidation
- The display of sexual or violent images
- Unwelcome sexual attention
- Nonconsensual or unwelcome physical contact
- Sustained disruption of talks, events or communications
- Incitement to violence, suicide, or self-harm
- Continuing to initiate interaction (including photography or recording) with someone after being asked to stop
- Publication of private communication without consent
Behaviour not explicitly mentioned above may still constitute harassment. The list above should not be taken as exhaustive but rather as a guide to make it easier to enrich all of us and the communities in which we participate. All CCRCN interactions should be professional regardless of location: harassment is prohibited whether it occurs on- or offline, and the same standards apply to both.
Enforcement of the Code of Conduct will be respectful and not include any harassing behaviors. Any changes to the meaning of this Code of Conduct must be approved by majority vote of the CCRCN Steering Committee. CCRCN working group and network members will be informed of these changes and any concerns that are raised will be discussed by the Steering Committee.
Thank you for helping make this a welcoming, friendly community for all.
This code of conduct is a modified version of that used by The Carpentries, which was a modified version of that used by PyCon, which in turn is forked from a template written by the Ada Initiative and hosted on the Geek Feminism Wiki. Contributors to this document: Adam Obeng, Aleksandra Pawlik, Bill Mills, Carol Willing, Erin Becker, Hilmar Lapp, Kara Woo, Karin Lagesen, Pauline Barmby, Sheila Miguez, Simon Waldman, Tracy Teal.
Statement of Collaboration
Members involved in CCRCN collaborations are entitled to their own intellectual property, and distinctions should be made clarifying what is individual property versus group property. Here are the principles to which the Soil Carbon working group adheres to:
- Anything developed as a group is collective intellectual property (IP) that members collectively decide what to do with (such as assigning a creative commons license or signing rights over to a publisher).
- Anything developed outside the group is the intellectual property of the individual who produced it or their institution (whichever is applicable).
- Any outside IP needs to be properly acknowledged and cited in CCRCN work.
- All members agree not to share unpublished work outside the group without explicit permission to do so.
- At the end of the project, working group members commit to making code and derivative data products that the group developed collectively open and available as part of data releases associated with papers and reports.
- The working group will publish products that only include data that is or will be publicly available (via repository) at the time of working group publication.
Participant Biographies
 Dr. Ariane Arias-Ortiz
Dr. Ariane Arias Ortiz is an environmental and marine scientist interested in carbon biogeochemical cycling, ecosystems dynamics and the use of radionuclides and tracers in environmental records/materials to study present, past and future processes related to climate change. Her PhD research focused in understanding the capacity of Blue Carbon ecosystems in storing carbon at different time scales and the carbon stock losses and loss rates associated to the degradation of these habitats. Currently, as a NOAA Climate and Global Change post-doctoral fellow at the Berkeley Biometeorology Lab (UCB) and Biogeochemistry lab (UCSC), she studies the balance between carbon burial, carbon emissions and lateral export in different wetland types (tidal and tidally-restricted, intact and restored, saline and freshwater) as well as the processes that control soil organic matter decomposition and associated CO2 and CH4 emissions..
Dr. Scott Bridgham
Scott Bridgham is a professor and an ecosystem ecologist in the Institute of Ecology and Evolution at the University of Oregon. He has examined the biogeochemistry of methane dynamics in freshwater wetlands since the late 1980s, working primarily in peatlands. He was the lead of the first State of the Carbon Cycle Report (SOCCR) for North American wetlands and participated in the second report that was published in 2018. He currently is examining methane dynamics at a large warming and elevated atmospheric CO2 manipulative experiment (SPRUCE) in a northern Minnesota peatland. More recently he started examining trace gas emissions and soil carbon sequestration rates in two Oregon estuaries in restored, natural, and disturbed conditions along salinity gradients.
 Dr. Etienne Fluet-Chouinard
Etienne is a Postdoctoral Research Fellow in the Department of Earth Systems Science. His research at Stanford University contributes to the Global Carbon Project methane budget by constraining the global distribution of wetland types using remote sensing and hydrological modeling, a key source of uncertainty in the global methane budget. Etienne’s background centers on the application of geospatial tools, remote sensing and modeling to the study of limnology and freshwater. His prior research has spanned a range of topics related to freshwater ecosystems at the global scale, ranging from anthropogenic stressors assessment, historical wetland drainage, wetland classification, conservation planning and inland fisheries underreporting.
Dr. Sara Knox
Dr. Sara Knox is an assistant professor in the Department of Geography at the University of British Columbia. Dr. Knox’s research focuses on measuring and modeling trace gas, water, and energy exchange in restored and natural wetlands to improve our understanding of the impacts of climate variability and human activities on wetland carbon and greenhouse gas dynamics. She investigates how wetland greenhouse gas fluxes respond to a changing climate and disturbances, and how we can modify land management practices for climate change mitigation and adaptation. She combines micrometeorological measurements with remote sensing and modelling to understand soil-plant-atmosphere interactions across a range of spatial and temporal scales. This research is done in collaboration with a broad group of researchers and institutions to help inform and advance climate policy. Visit her website here.
 Dr. Gavin McNicol
Gavin McNicol is a postdoctoral fellow at Stanford University where he contributes to the Global Carbon Project’s FLUXNET-CH4 synthesis activity. His PhD from UC Berkeley focused on wetland biogeochemistry and ecosystem ecology in restored California Delta marshes where he downscaled ecosystem methane fluxes to wetland patches and used isotopic analyses to understand the provenance of wetland methane production. Gavin is broadly interested in improving understanding of methane biogeochemistry across microbial to global scales, including mitigation opportunities in human managed systems such as restored wetlands and the waste sector. In his current position he is compiling eddy covariance methane flux measurements across FLUXNET and leading an effort to produce a globally gridded product for freshwater wetland methane fluxes using remote sensing and machine learning techniques.
Dr. Brian Needelman
Dr. Brian Needelman is an Associate Professor of Soil Science at the University of Maryland in the Department of Environmental Science & Technology. He teaches and performs research in the fields of soil science, pedology, coastal wetlands, and coastal resiliency. His coastal wetland research focuses on management and restoration practices to increase tidal marsh sustainability. He also conducts research on greenhouse gas emissions and accounting in coastal wetland systems including carbon sequestration and methane emissions. His coastal resiliency research focuses on the integration of natural and social science approaches to better understand and increase the resilience of coastal socio-ecological systems.
 Sarah Russell
Sarah Russell is completing an MSc in Geography at the University of British Columbia. She received a BS in Biological Sciences from Wellesley College in 2017. She is interested in land-atmosphere carbon dynamics and quantifying the terrestrial carbon sink. Her research at UBC involves modeling greenhouse gas fluxes from restored tidal wetlands in the Sacramento-San Joaquin River Delta.
Dr. Debjani Sihi
I am an environmental biogeochemist with a broad research interest in the role of microbial- and enzyme-mediated processes in soil organic matter decomposition and greenhouse gas emissions from natural and managed systems. I have taken leadership roles in various research projects at the interface of soil microbial ecology, evolutionary biology, and ecosystem ecology. My research work includes both empirical studies and process-based modeling. I use biogeochemical models to evaluate the fate of soil (and ecosystem) carbon (and nutrient) in the face of climate change in systems ranging from the tropics (El Yunque National Forest in Puerto Rico) and subtropics (Florida Everglades) to temperate (Harvard Forest, MA, USA) and boreal transition forests (Howland Forest, ME, USA).
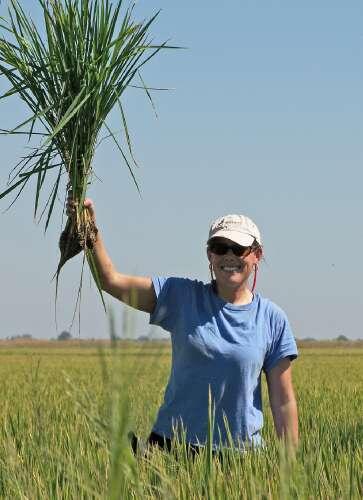 Dr. Lisa-Marie Windham Myers
Dr. Lisamarie Windham-Myers is a wetland ecologist and lead scientist for the USGS-NRP program “Plant:Soil:Water Interactions in Wetland Ecosystems”. Broadly-trained in ecosystem ecology, her research focuses on plant physiology and its influence on carbon, nutrient, and trace-metal biogeochemistry. Her approaches span landscape-to-molecular scales as necessary to understand how human and stochastic alterations of wetland structure influence wetland function. A San Francisco Bay native, her local research sites represent a wide range of salinity and management conditions, from rice agriculture to coastal and restored wetlands. Lisa serves in several local, national and international science advisory efforts to evaluate wetland management and modeling approaches to quantify wetland carbon sequestration, greenhouse gas budgets and/or mercury methylation and export. Visit her website here.
Administrator Biographies
Dr. Patty Oikawa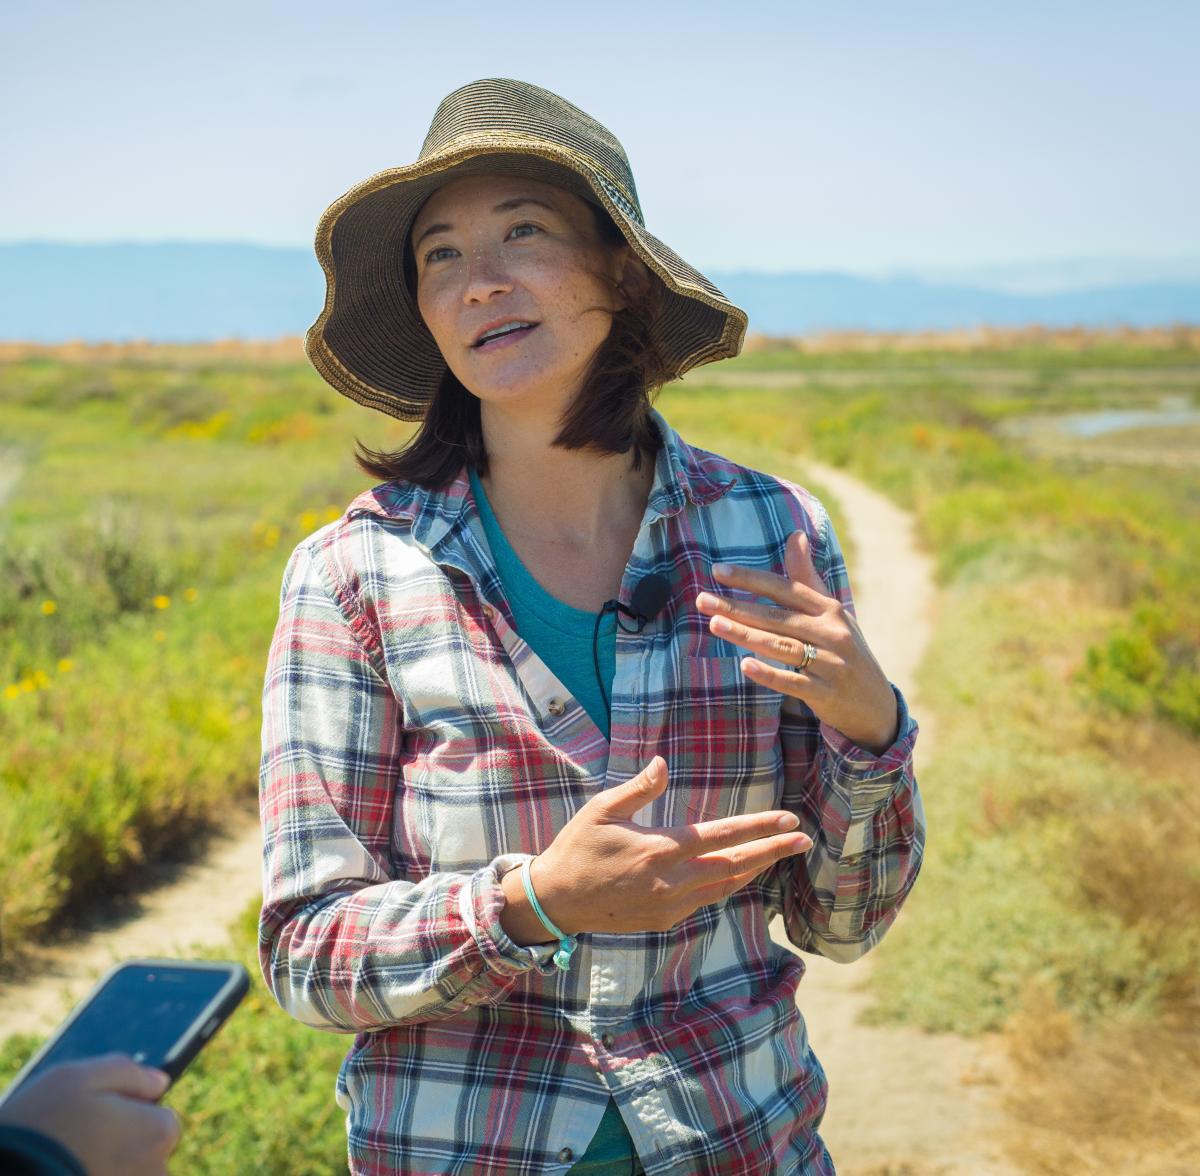
Dr. Patty Oikawa is an assistant professor in the Department of Earth and Environmental Sciences at the California State University, East Bay. Patty is a biogeochemist who specializes in biosphere-atmosphere interactions. Her research investigates how land management practices influence greenhouse gas emissions and the role of land management in climate change mitigation. Patty employs field monitoring and manipulation techniques with a focus on micrometeorology. She also specializes in process-based biogeochemical modeling and model-data fusion approaches. She collaborates with regional to global-scale modeling projects and is actively incorporating models into carbon policies in California. Visit her website for more information.
 Dr. James Holmquist
James Holmquist is an ecologist at the Smithsonian Environmental Research Center, specializing in global change and carbon cycling in wetlands. In 2015 he joined a NASA-funded project tracking U.S. coastal wetland greenhouse gas storage and emissions. He now manages the Coastal Carbon Research Coordination Network, and is the PI of a NASA Carbon Monitoring Systems project on Forecasting Coastal Carbon. James aims to improve the state of science and management using data synthesis, teamwork, and training.
Dr. Patrick Megonigal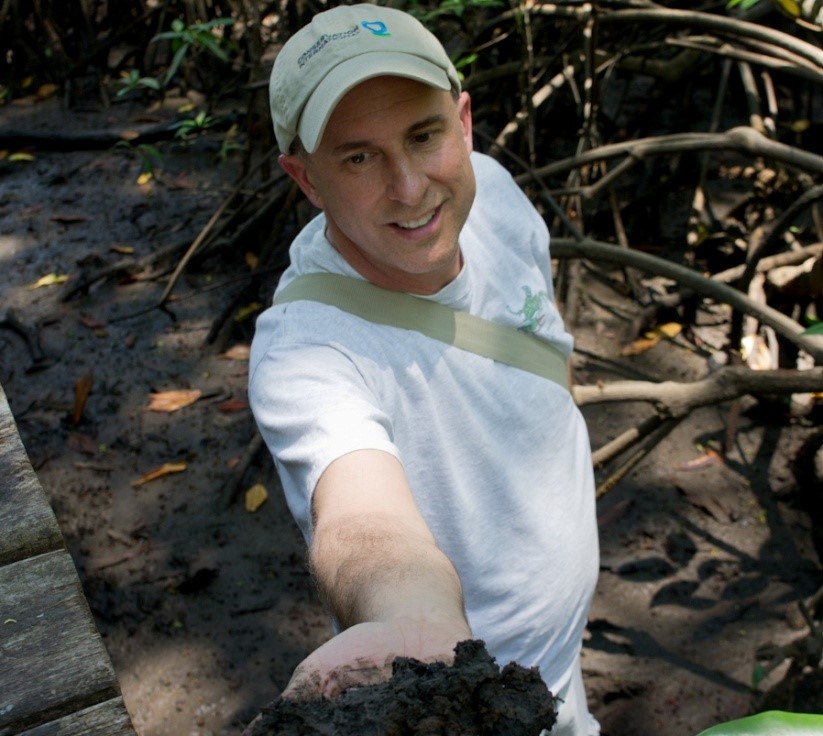
Pat Megonigal is Senior Scientist and Associate Director of Research at the Smithsonian Environmental Research Center. Dr. Megonigal is an ecosystem ecologist with research interests in carbon and greenhouse gas cycling in wetlands and forests, particularly as they relate to global change. He is the Lead Investigator of the Smithsonian’s Global Change Research Wetland, a long-term research site dedicated to understanding the stability of tidal wetlands faced with accelerated sea level rise and biogeochemical interactions between wetlands and estuaries. Dr. Megonigal is a contributing author to the Coastal Blue Carbon Handbook and the VCS Methodology on Restoration of Tidal Wetlands and Seagrasses, and he is a member of the Scientific Working Group of the Blue Carbon Initiative.
D r. Jim Tang
Jim Tang is interested in ecosystem biogeochemistry, soil-plant-atmosphere interactions, and global change ecology. His research focuses on the impacts of climate change and human activities on ecosystem processes and functions, and the feedback to the climate and Earth system. He uses observational, experimental, and modeling approaches to understand and simulate carbon, nitrogen, and water cycles within ecosystems and between the Earth surface and the atmosphere across various scales. His research improves our understanding of ecosystem services and informs sound environmental and climate policies.
Soil Carbon Working Group
CCN Code of Conduct
The Coastal Carbon Network (CCN) is dedicated to providing a welcoming and supportive environment for all people, regardless of background or identity. However, we recognise that some groups in our community are subject to historical and ongoing discrimination, and may be vulnerable or disadvantaged. Membership in such a specific group can be on the basis of characteristics such as gender, sexual orientation, disability, physical appearance, body size, race, nationality, sex, colour, ethnic or social origin, pregnancy, citizenship, familial status, veteran status, genetic information, religion or belief, political or any other opinion, membership of a national minority, property, birth, age, or choice of text editor. We do not tolerate harassment of participants on the basis of these categories, or for any other reason.
Harassment is any form of behaviour intended to exclude, intimidate, or cause discomfort. Because we are a diverse community, we may have different ways of communicating and of understanding the intent behind actions. Therefore we have chosen to prohibit certain forms of behaviour in our community, regardless of intent. Prohibited harassing behaviour includes but is not limited to:
- Written or verbal comments which have the effect of excluding people on the basis of membership of a specific group listed above
- Causing someone to fear for their safety, such as through stalking, following, or intimidation
- The display of sexual or violent images
- Unwelcome sexual attention
- Nonconsensual or unwelcome physical contact
- Sustained disruption of talks, events or communications
- Incitement to violence, suicide, or self-harm
- Continuing to initiate interaction (including photography or recording) with someone after being asked to stop
- Publication of private communication without consent
Behaviour not explicitly mentioned above may still constitute harassment. The list above should not be taken as exhaustive but rather as a guide to make it easier to enrich all of us and the communities in which we participate. All CCN interactions should be professional regardless of location: harassment is prohibited whether it occurs on- or offline, and the same standards apply to both.
Enforcement of the Code of Conduct will be respectful and not include any harassing behaviors. Any changes to the meaning of this Code of Conduct must be approved by majority vote of the CCN Steering Committee. CCN working group and network members will be informed of these changes and any concerns that are raised will be discussed by the Steering Committee.
Thank you for helping make this a welcoming, friendly community for all.
This code of conduct is a modified version of that used by The Carpentries, which was a modified version of that used by PyCon, which in turn is forked from a template written by the Ada Initiative and hosted on the Geek Feminism Wiki. Contributors to this document: Adam Obeng, Aleksandra Pawlik, Bill Mills, Carol Willing, Erin Becker, Hilmar Lapp, Kara Woo, Karin Lagesen, Pauline Barmby, Sheila Miguez, Simon Waldman, Tracy Teal.
CCN Statement of Collaboration
Members involved in CCN collaborations are entitled to their own intellectual property, and distinctions should be made clarifying what is individual property versus group property. Here are the principles to which the Soil Carbon working group adheres to:
- Anything developed as a group is collective intellectual property (IP) that members collectively decide what to do with (such as assigning a creative commons license or signing rights over to a publisher).
- Anything developed outside the group is the intellectual property of the individual who produced it or their institution (whichever is applicable).
- Any outside IP needs to be properly acknowledged and cited in CCN work.
- All members agree not to share unpublished work outside the group without explicit permission to do so.
- At the end of the project, working group members commit to making code and derivative data products that the group developed collectively open and available as part of data releases associated with papers and reports.
- The working group will publish products that only include data that is or will be publicly available (via repository) at the time of working group publication.
Participant Biographies
Dr. E. Fay Belshe 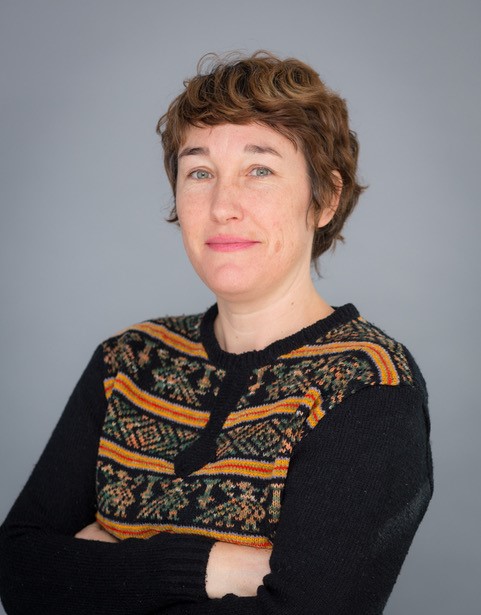
Dr. Fay Belshe is interested in how organic matter (OM) forms and decays within soils of coastal vegetated ecosystems, specifically seagrasses. Her work explores the mechanisms and controls governing OM persistence and residence times, with a focus on how living OM (plants, microbes), dead OM, and soil properties interact to determine the dynamic cycling of carbon under a constant and changing climate.
Dr. Brandon Boyd
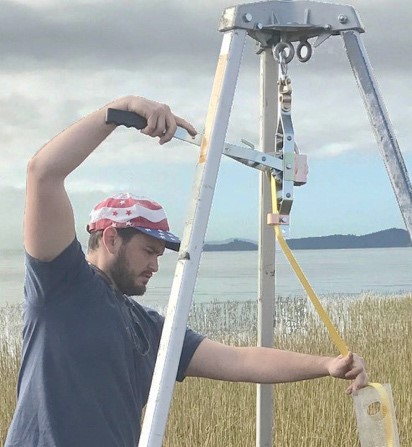 Dr. Brandon Boyd’s research is focused on physical and biological processes in tidal marshes and how those marshes connect with estuary or coastal system. Dr. Boyd uses his expertise in radionuclide chronology and tracers to identify and quantify processes in those systems. His projects are often focused on determining how vertical accretion in restored wetlands may differ from their natural neighbors and designing marsh restorations with balance between storm resilience and ecologic benefit. To learn more about Dr. Boyd’s research, visit his lab website here.
Lauren Brown
Lauren completed her MA in Geography at UCLA and is finishing her PhD in the same program working with Dr. Glen MacDonald. While at UCLA she has collected sediment cores from over 10 marshes, spanning the California coast from Humboldt Bay to Tijuana River Estuary. She uses these sediment cores to investigate vulnerability to SLR, carbon storage, and long-term environmental change. Methods she has employed include radiometric dating, LOI, grain size analysis, EA, XRF, macro charcoal, and biological proxy data. Her final year of the PhD will be dedicated to improving her data management and analyses skills.
Dr. Samantha Chapman
Dr. Samantha Chapman has been a professor and scientist at Villanova University in Pennsylvania, USA since 2007. She is also currently the Anne Quinn Welsh Honors Faculty Fellow. Sam received her Ph.D. from Northern Arizona University and did a postdoctoral fellowship at the Smithsonian Environmental Research Center. Dr. Chapman is an ecosystem ecologist who is interested in how climate change and altered biodiversity change the services that ecosystems provide. She has received grants from NASA, The U.S. National Science Foundation, The U.S. Forest Service and the U.S. Department of Agriculture to conduct her research. Sam and her team collaborate on projects ranging from learning how climate change and rising sea levels alter coastal ecosystems to assessing how nitrogen pollution impacts invasive plant species. For more information on research projects, see her lab group website here.
Dr. Ron Corstanje
Dr. Ron Corstanje is a professor of Data Sciences at Cranfield and Head of the Centre for Environmental and Agricultural Informatics. He specialises in the application of spatio-temporal models to understand the nature and behaviour of natural systems and processes. Ron is interested in the application of (spatial) modelling tools to understand the structure and function of environmental systems and processes. Environmental systems are complex, and this expresses itself as complex but determinable spatiotemporal patterns. The application of these approaches has led to significant advances in understanding on the spatial dynamics of ecosystem services, across systems including wetlands. Another key area in which these techniques have proven invaluable is in the area of resilience as applied to ecological systems, allowing significant insights into the nature and functioning of resilience. Both these areas have significant societal significance, in helping inform how to infer resilience in the natural and man-made systems on which we depend, but also in how to design and plan the environment to retain the benefits from the natural capital inherent in our greenspaces.
Dr. Meagan Gonneea
Dr. Meagan Gonneea is a research scientist at the US Geological Survey Woods Hole Coastal and Marine Science Center. She utilizes a suite of geochemical tools, including naturally occurring radioisotopes in the Uranium-Thorium decay series, to understand both the magnitude and rate of change within coastal ecosystems. In particular, Meagan is interested in how salt marshes have responded to more than a century of accelerating sea level rise, with a focus on their ability to store carbon and dynamically build elevation. She combines historical ecosystem information, gleaned from analysis of salt marsh peat, with modern environmental drivers to constrain future ecosystem responses.
Dr. Christopher Janousek
Dr. Janousek is a coastal wetlands ecologist and Assistant Professor (Senior Research) at Oregon State University. His academic training was completed at UC Santa Cruz (BA), UC San Diego (PhD), and UC Davis (post-doc). His main research interest is in coastal plant community ecology along the Pacific coast of the United States. His research also addresses coastal climate change, blue carbon, estuarine hydrology, and wetlands restoration. He is a wilderness and National Parks enthusiast and enjoys backpacking, tidepooling, kayaking, nature photography, and nature writing.
Dr. James Morris
Dr. James Morris is a Professor of Biological and Marine Sciences at the University of South Carolina and a Fellow of the Society of Wetland Scientists and of the American Association for the Advancement of Science. Morris has served on numerous committees and panels, including those of the US National Science Foundation, the Irish National Science Foundation, the National Research Council of the National Academy of Sciences, and the IndoFlux committee of India. He also is a current member of the Conservation International/UNESCO Blue Carbon Working Group and NOAA’s NERR Science Collaborative Advisory Board. Dr. Morris has a long history of research at North Inlet, SC on the effects on coastal wetlands of changing sea-level. His discovery of a stabilizing feedback between marsh primary production, vertical marsh accretion, and sea-level rise has led to the development of the field of marsh biogeomorphology. He is PI of an NSF LTREB project at North Inlet, SC, co-PI of the NSF Plum Island LTER project in Massachusetts, and is the developer of the Marsh Equilibrium Model (MEM) and the Cohort Theory Model (CTM). Visit his website here.
Dr. Gregory Noe
Dr. Greg Noe has been a Research Ecologist with the U.S. Geological Survey's Water Mission Area in Reston, VA since 2002. Greg studies mud. His research focuses on the interactive influences of geomorphology, hydrology, climate, and biology on nitrogen and phosphorus and carbon biogeochemistry and sediment transport in fluvial ecosystems, as well as plant community ecology and restoration ecology. He has been studying the effect of sea level rise and salinization on tidal freshwater forested wetland ecosystem resilience and C cycling and sequestration in Virginia, Maryland, South Carolina, and Georgia.
Dr. André Rovai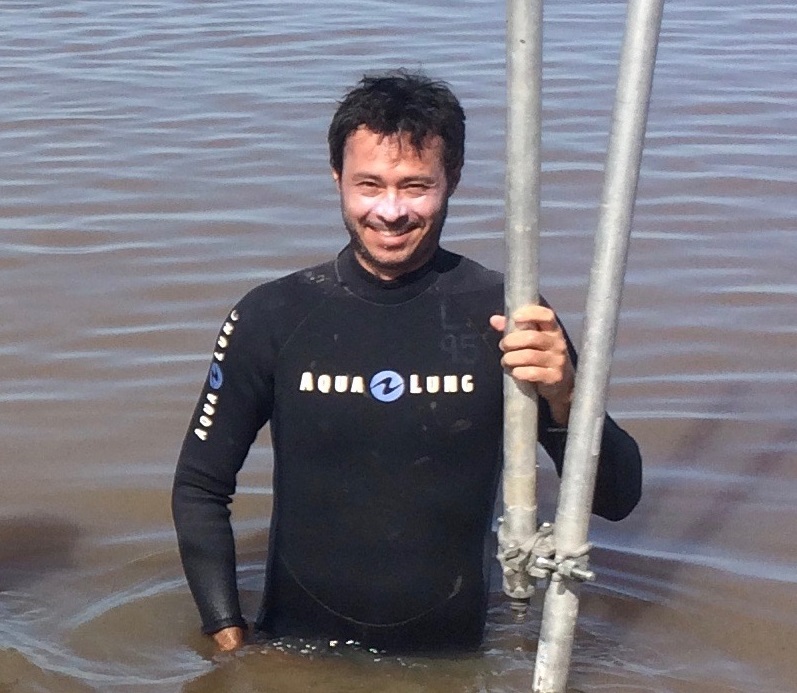
Dr. Rovai is a Research Associate at the Department of Oceanography & Coastal Sciences at Louisiana State University. He is a marine ecologist who is interested in the potential role of coastal wetlands in mitigating the effects of greenhouse gases. Specifically, his research focuses on global controls on carbon storage and sequestration in coastal wetlands in response to geophysical and climatic drivers as well as climate change, with an emphasis on deltaic coastlines.
Dr. Jonathan Sanderman
Dr. Sanderman is a biogeochemist who specializes in understanding how soil carbon and nutrient cycles have been altered by land-use and climate change. He is particularly interested in understanding the carbon sink capacity of soils and coastal sediments and whether or not these sinks can be managed to mitigate climate change. Prior to joining the Center, Dr. Sanderman spent six years as a research scientist at the Australian Commonwealth Scientific and Industrial Research Organization. Dr. Sanderman holds a B.S. from Brown University and a Ph.D. from the University of California, Berkeley.
Dr. Amanda Spivak
Dr. Amanda Spivak focuses on developing an integrated understanding of ecological and biogeochemical processes in order to refine the role of coastal ecosystems in the global carbon cycle and predict the likelihood of recovery from human disturbances. She uses innovative geochemical tracer approaches, including stable isotopes and lipid biomarkers, in combination with landscape-scale experiments to quantify carbon pathways, transformations, and fate.
Dr. Katherine Todd-Brown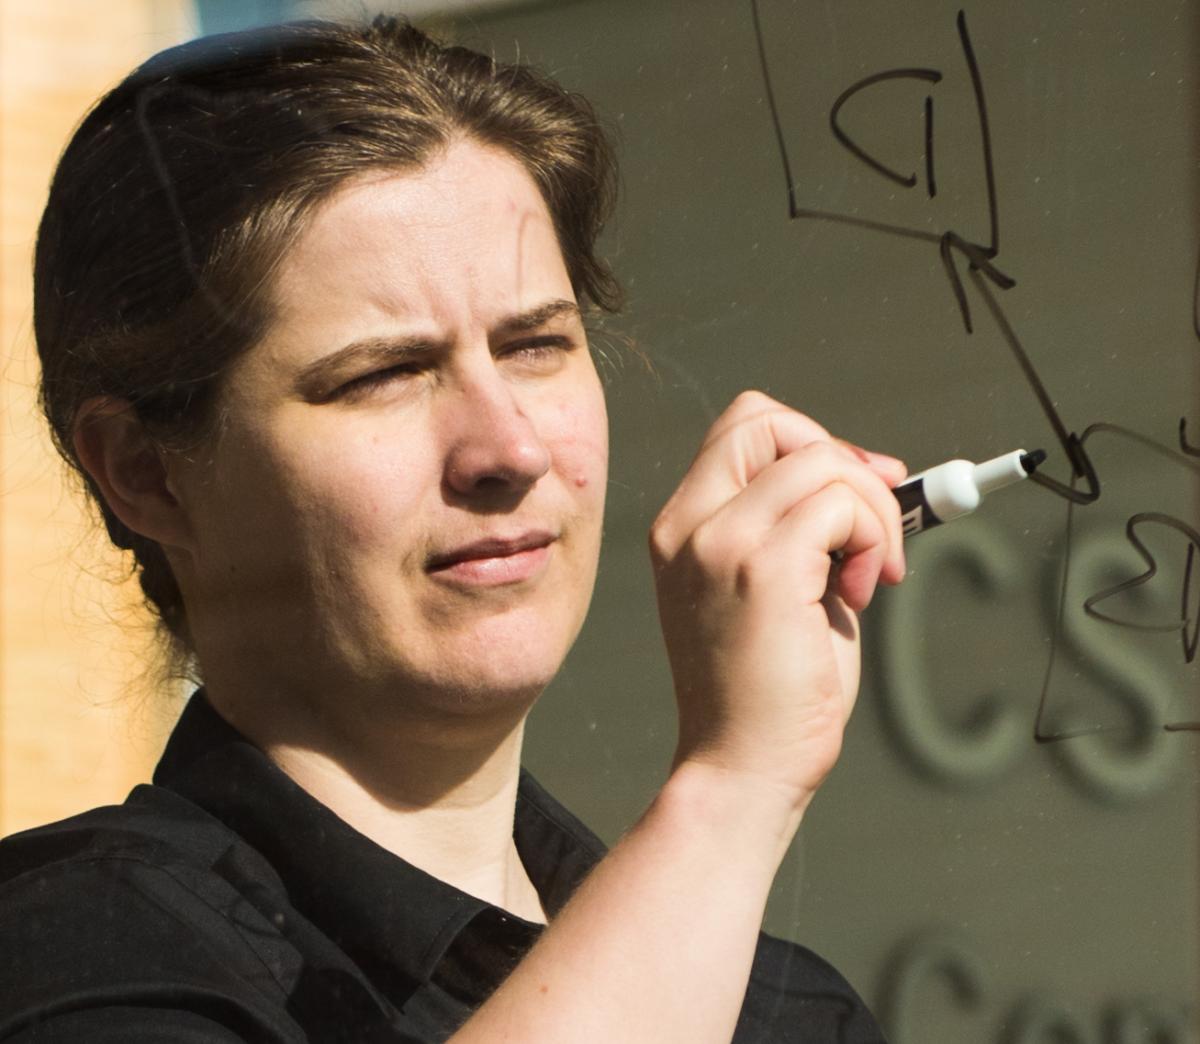
Dr. Kathe Todd-Brown is a computational biogeochemist. She specializes in soil carbon model analysis and theoretical development from the micro to global scales. She is currently a post-doctoral fellow at Wilfrid Laurier University and the data coordinator for the International Soil Carbon Network. Learn more about her work at her website here.
Megan Vahsen
Megan is interested in the potential for rapid evolution to drive ecosystem-level processes. She completed her M.S. in Ecology at Colorado State and is currently a Ph.D. student at Notre Dame working with Jason McLachlan to understand how the evolution of a marsh sedge (Schoenoplectus americanus) influences marsh accretion in the Chesapeake Bay. Megan uses field experiments, Bayesian modeling, and near-term ecological forecasting to address this question.
Administrator Biographies
Dr. Patrick Megonigal
Pat Megonigal is Senior Scientist and Associate Director of Research at the Smithsonian Environmental Research Center. Dr. Megonigal is an ecosystem ecologist with research interests in carbon and greenhouse gas cycling in wetlands and forests, particularly as they relate to global change. He is the Lead Investigator of the Smithsonian’s Global Change Research Wetland, a long-term research site dedicated to understanding the stability of tidal wetlands faced with accelerated sea level rise and biogeochemical interactions between wetlands and estuaries. Dr. Megonigal is a contributing author to the Coastal Blue Carbon Handbook and the VCS Methodology on Restoration of Tidal Wetlands and Seagrasses, and he is a member of the Scientific Working Group of the Blue Carbon Initiative.
Dr. James Holmquist
James Holmquist is an ecologist at the Smithsonian Environmental Research Center, specializing in global change and carbon cycling in wetlands. In 2015 he joined a NASA-funded project tracking U.S. coastal wetland greenhouse gas storage and emissions. He directs the Coastal Carbon Network, and aims to improve the state of science and management using data synthesis, teamwork, and training.
Dr. Lisa-Marie Windham Myers
Dr. Lisamarie Windham-Myers is a wetland ecologist and lead scientist for the USGS-NRP program “Plant:Soil:Water Interactions in Wetland Ecosystems”. Broadly-trained in ecosystem ecology, her research focuses on plant physiology and its influence on carbon, nutrient, and trace-metal biogeochemistry. Her approaches span landscape-to-molecular scales as necessary to understand how human and stochastic alterations of wetland structure influence wetland function. A San Francisco Bay native, her local research sites represent a wide range of salinity and management conditions, from rice agriculture to coastal and restored wetlands. Lisa serves in several local, national and international science advisory efforts to evaluate wetland management and modeling approaches to quantify wetland carbon sequestration, greenhouse gas budgets and/or mercury methylation and export. Visit her website here.
David Klinges
David is a Data Technician in the biogeochemistry lab at the Smithsonian Environmental Research Center, and assists in managing the Coastal Carbon Network. He specializes in ecological data curation and synthesis, as well as designing web interfaces and data-access tools. David possesses a B.A. in Biological Sciences from Dartmouth College. Visit his website here.
Return to Top
Soil Carbon Working Group
Improved measuring, reporting, modeling, and mapping of soil carbon burial rates and carbon stocks in coastal wetlands
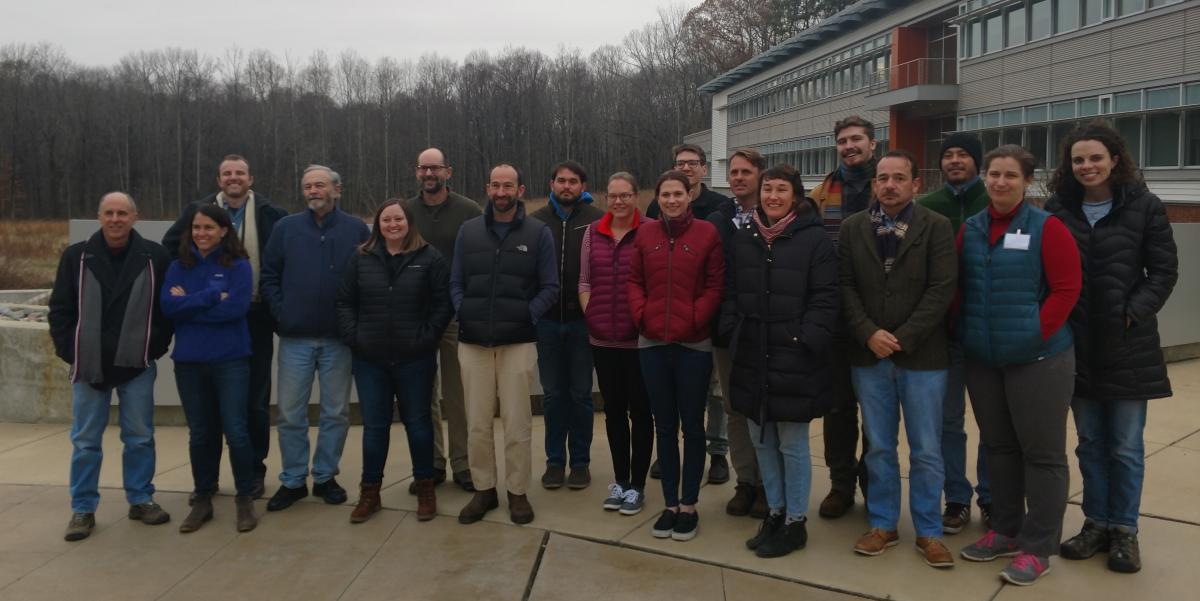
Time and Location:
December 8 and 9, 2018, hosted at the Smithsonian Environmental Research Center, Edgewater, Maryland
Research Questions:
1. What is the potential for pairing Bayesian statistical methods with process-based modeling to map carbon stocks and sequestration rates?
2. How much variation in carbon stocks and burial rates is attributable to field and lab techniques, and how much to process uncertainty?
Final Products:
1. Paper on modeling and forecasting soil carbon sequestration rates
2. Papers on best practices for field, lab, and data management
3. Open-source R package(s) of marsh equilibrium models
4. Mapped products at the scale of the contiguous United States if applicable
Working Group Application
**APPLICATIONS FOR THE "IMPROVED PROCESS MODELING AND MAPPING OF TIDAL WETLANDS METHANE EMISSIONS" WORKING GROUP ARE CLOSED.**
A goal of the CCRCN is to quantitatively improve the state of the science. One of our proposed activities is to use five topical working groups over the next five years to share data and expertise. The steering committee has decided to announce the titles and timing of the first two working groups, and suggestions for future working groups. Our decisions have been made based on three insights:
1. The initial results of a sensitivity analysis of U.S. coastal wetland flux which quantitatively rank priorities for reducing uncertainty.
2. Feedback from you at our 2017 AGU Town Hall, our 2018 community priorities survey, and individual outreach with many of you.
3. A recognition that the CCRCN steering committee needs to offer enough detail and leadership so that the workshops have direction, but not at the expense of remaining flexible to the changing nature of research and community priorities over the next five years.
The five workshops are:
1. Improved measuring, reporting, modeling, and mapping of soil carbon burial rates and carbon stocks in coastal wetlands
Time and Location: December 8 and 9 (before AGU), hosted at the Smithsonian Environmental Research Center, Edgewater, Maryland
Research Questions: 1. How much variation in carbon stocks and burial rates is attributable to field and lab techniques, and how much to environmental covariates? 2. What is the potential for machine learning or process-based modeling to map carbon stocks and burial rates?
Final Products: 1. Paper on best practices for field, lab, and data management; 2. papers on modeling and mapping; 3. Mapped products at the scale of the contiguous United States if applicable.
2. Improved process modeling and mapping of tidal wetland methane emissions
Applications now being accepted!
Timing and Location: Workshop will be in December 2019, exact time and location TBD. Working group members will commit to remote collaboration in the months leading up to a two-day workshop, and are expected to contribute at the level of co-author to 1-2 culminating papers.
Potential Future Working Groups
Detecting Carbon Flux Associated with Wetland Loss and Restoration (Timing: 2020 or 2021)
CO2 Vertical Flux and Scaling from the Chamber, Eddy Flux, to the Globe (Timing: 2020 or 2021)
Quantifying Uncertainty Reduced by CCRCN Products, Scaling Outside the US, Determining New Research Priorities (Timing: 2022)
Each participant will be expected to agree to a code of conduct, contribute at the level of a coauthor, participate in remote collaboration in the months leading up to a two day workshop, attend all of the workshop, and assist in revising analyses and reviewing paper drafts following the workshop. We strongly encourage students and early career scientists to apply, especially as participation in data synthesis may advance publication and career opportunities. To maximize the diversity and number of participants, applicants should not expect to be selected for more than two working groups over the next five years. Travel funding will be provided for in-person workshops. Unfortunately funding for non-U.S. based collaborators is very limited. If you can provide your own funding, please indicate this on the application as it may free up funds for international participants.
Please indicate your ranked preferences 1 = highest, 5 = lowest.
Data
Coastal Carbon Data Library and Atlas
One of the core activities of the Coastal Carbon Network (CCN) is to facilitate the stewardship of carbon data collected from tidal wetland habitats around the world. We do this by providing publishing services to the research community and maintaining a synthetic archive of open-source data, called the Coastal Carbon Data Library. This public resource is curated and maintained by CCN personnel, and continues to grow through contribution from the research community. Presently, the CCN Data Library (V1.5.0) contains over 16,143 soil profiles from 70 countries across 64 years, and includes representation of Blue Carbon habitats such as marsh, mangrove, seagrass, and tidal freshwater wetlands.
The database is designed to both accommodate and standardize carbon data across the wide array of studies that have been or will be conducted across various tidal wetland habitats. The CCN strives for transparency with methods of data archival, quality control, and management. Read more about the database structure on our Community Resources Portal.
![]()
Coastal Carbon Atlas
This novel Blue Carbon tool enables users to explore, query, and download data from the Coastal Carbon Data Library. For more information on how to navigate this application, please download our CCA User Tutorial (which is also available in Spanish).
CCN-assembled Data Publications
Data Product |
Data Components |
Last Updated |
|---|---|---|
| Lerberg et al. (2025) | B. Lerberg, Scott; Demeo, Alex; Brooks, Hank; Reilly, Erin; Connell, Jennifer; Kivimaki, Katherine; et al. (2025). Dataset: Carbon storage and accretion in Sweet Hall Marsh, Virginia. Smithsonian Environmental Research Center. Dataset. https://doi.org/10.25573/serc.27637311 | 27 January 2025 |
| Janousek et al. (2025) | Janousek, Christopher; Williams, Trevor; McKeon, Maggie; Bridgham, Scott D.; Cornu, Craig; Diefenderfer, Heida; et al. (2025). Dataset: Fluxes of carbon dioxide, methane, and nitrous oxide and associated environmental data from estuarine wetlands in the Pacific Northwest, USA. Smithsonian Environmental Research Center. Dataset. https://doi.org/10.25573/serc.27161883 | 23 January 2025 |
| Janousek et al. (2025) | Janousek, Christopher N.; Krause, Johannes Renke; Drexler, Judith Z.; Buffington, Kevin J.; Poppe, Katrina L.; Peck, Erin K.; et al. (2025). Dataset: Carbon stocks and environmental driver data for blue carbon ecosystems along the Pacific coast of North America. Smithsonian Environmental Research Center. Dataset. https://doi.org/10.25573/serc.28127486 | 17 January 2025 |
| Cifuentes-Jara and Torres (2024) | Cifuentes-Jara, Miguel; Torres Gómez, Danilo (2024). Dataset: Evaluation of carbon in the National Forest of Térraba-Sierpe, Costa Rica. Smithsonian Environmental Research Center. Dataset. https://doi.org/10.25573/serc.26999278 | 31 October 2024 |
| Poppe et al. (2024) | Poppe, Katrina; Bridgham, Scott D.; Janousek, Christopher; Williams, Trevor; Cornu, Craig; Perillat, Heather; et al. (2024). Dataset: Soil carbon stocks and long-term accretion rates in tidal marshes, tidal swamps, and former tidal wetlands in eight estuaries in the Pacific Northwest, USA. Smithsonian Environmental Research Center. Dataset. https://doi.org/10.25573/serc.27156465 | 31 October 2024 |
| Cifuentes-Jara et al. (2024) | Cifuentes-Jara, Miguel; Torres Gómez, Danilo; Molina Lara, Oscar; Velásquez Mazariegos, Sergio; Rivera, Carlos; Magaña Rivas, Javier (2024). Dataset: Land cover dynamics and carbon stocks in El Salvador mangroves. Smithsonian Environmental Research Center. Dataset. https://doi.org/10.25573/serc.25828603 | 30 August 2024 |
| Arias-Ortiz et al. (2024) | Arias-Ortiz, Ariane; D. Bridgham, Scott; Holmquist, James; Knox, Sarah; McNicol, Gavin; Needleman, Brian; et al. (2024). Dataset: Chamber-based Methane Flux Measurements and Other Greenhouse Gas Data for Tidal Wetlands across the Contiguous United States - An Open-Source Database. Smithsonian Environmental Research Center. Dataset. https://doi.org/10.25573/serc.14227085 | 13 August 2024 |
| Searle et al. (2024) | Searle, Andrew; Ndhlovu, Andrew; von der Heyden, Sophie (2024). Dataset: Unearthing blue carbon core microbiomes: patterns and drivers shaping sediment communities between seagrass, salt marsh and mangrove ecosystems. Smithsonian Environmental Research Center. Dataset. https://doi.org/10.25573/serc.26120026 | 25 July 2024 |
| Adotey et al. (2024) | Adotey, Joshua; Aheto, Denis Worlanyo; Blay, John; Acheampong, Emmanuel (2024). Dataset: Carbon Stock Assessment in the Kakum and Amanzule Estuary Mangrove Forests, Ghana. Smithsonian Environmental Research Center. Dataset. https://doi.org/10.25573/serc.25148561 | 12 June 2024 |
| Spera and White (2024) | Spera, Alina C.; White, John R. (2024). Dataset: Tidal and nontidal marsh restoration: a trade-off between carbon sequestration, methane emissions, and soil accretion. Smithsonian Environmental Research Center. Dataset. https://doi.org/10.25573/serc.20807278 | 12 June 2024 |
| Johnson et al. (2024) | Johnson, Beverly J; Kulesza, Ashley; Pickoff, Margaret; Stames, Daniel; Gunn, Cailene; Karboski, Brianna; et al. (2024). Dataset: Sediment carbon content of Maine salt marshes. Smithsonian Environmental Research Center. Dataset. https://doi.org/10.25573/serc.17018816 | 12 June 2024 |
| Johnson et al. (2024) | Johnson, Beverly; Sonshine, Emily; Doyle, John (2024). Dataset: Sediment carbon content of coastal Maine eelgrass beds. Smithsonian Environmental Research Center. Dataset. https://doi.org/10.25573/serc.22779893 | 12 June 2024 |
| Stevens et al. (2024) | Stevens, Luke; Corbett, D. Reide; Culver, Stephen (2024). Sediment Accumulation in Salt Marshes Across the Southeastern United States. Smithsonian Environmental Research Center. Dataset. https://doi.org/10.25573/serc.25289635 | 23 April 2024 |
| Strand et al. (2024) | Strand, Jessica; Corbett, D. Reide (2024). Dataset: Examining Coastal Marsh Sedimentation in Northeastern North Carolina. Smithsonian Environmental Research Center. Dataset. https://doi.org/10.25573/serc.24991359 | 24 April 2024 |
| Quafisi et al. (2024) | Quafisi, Dimitri; Corbett, D. Reide (2024). Dataset: Assessment of Modern Sediment Storage in the Floodplain of the Lower Tar River, North Carolina. Smithsonian Environmental Research Center. Dataset. https://doi.org/10.25573/serc.25075568 | 22 April 2024 |
| Tully et al. (2024) | Tully, Lancen S.; Corbett, D. Reide (2024). Dataset: Evaluation of Sediment Dynamics using Geochemical Tracers in the Pamlico Sound Estuarine System, North Carolina. Smithsonian Environmental Research Center. Dataset. https://doi.org/10.25573/serc.24968412 | 29 March 2024 |
| Kemp et al. (2024) | C. Kemp, Andrew; P. Horton, Benjamin; J. Culver, Stephen; Corbett, D. Reide; van de Plassche, Orson; Gehrels, W. Roland; et al. (2024). Dataset: Timing and magnitude of recent accelerated sea-level rise (North Carolina, United States). Smithsonian Environmental Research Center. Dataset. https://doi.org/10.25573/serc.24910587 | 28 March 2024 |
| Machite et al. (2024) | Machite, Anesu; Raw, Jaqueline; Adams, Janine (2024). Dataset: A Synthesis of South African Estuaries. Smithsonian Environmental Research Center. Dataset. https://doi.org/10.25573/serc.24394426 | 06 March 2024 |
| Morgan et al. (2024) | Morgan, Pamela; Burdick, David; Short, Frederick (2024). Dataset: Soil organic matter in fringing and meadow salt marshes in Great Bay, New Hampshire and southern Maine. Smithsonian Environmental Research Center. Dataset. https://doi.org/10.25573/serc.25222124 | 01 March 2024 |
| Vincent and Dionne (2023) | Vincent, Robert; Dionne, Michele (2023). Dataset: Sediment Carbon Content from three Maine Salt Marshes 1993. Smithsonian Environmental Research Center. Dataset. https://doi.org/10.25573/serc.23960793 | 09 November 2023 |
| Palinkas and Engelhardt (2024) | Palinkas, Cindy M.; Engelhardt, Katharina A. M. (2024). Dataset: Spatial and temporal patterns of modern sedimentation in a tidal freshwater marsh. Smithsonian Environmental Research Center. Dataset. https://doi.org/10.25573/serc.24470152 | 31 January 2024 |
| Palinkas and Cornwell (2024) | Palinkas, Cindy M.; Cornwell, Jeffrey (2024). Dataset: A Preliminary Sediment Budget for the Corsica River (MD): Improved Estimates of Nitrogen Burial and Implications for Restoration. Smithsonian Environmental Research Center. Dataset. https://doi.org/10.25573/serc.24467977 | 31 January 2024 |
| Craft (2024) | Craft, Christopher (2024). Dataset: Tidal freshwater forest accretion does not keep pace with sea level rise. Smithsonian Environmental Research Center. Dataset. https://doi.org/10.25573/serc.24895293 | 30 January 2024 |
| Stahl et al. (2024) | Stahl, McKenna; Widney, Sarah; Craft, Christopher (2024). Dataset: Tidal freshwater forests: Sentinels for climate change. Smithsonian Environmental Research Center. Dataset. https://doi.org/10.25573/serc.24886155 | 30 January 2024 |
| Drake et al. (2024) | Drake, Katherine; Halifax, Holly; Adamowicz, Susan, C.; Craft, Christopher (2024). Dataset: Carbon Sequestration in Tidal Salt Marshes of Northeast United States. Smithsonian Environmental Research Center. Dataset. https://doi.org/10.25573/serc.24518770 | 30 January 2024 |
| Loomis and Craft (2024) | Loomis, Mark, J.; Craft, Christopher (2024). Dataset: Carbon Sequestration and Nutrient (Nitrogen, Phosphorus) Accumulation in River-Dominated Tidal Marshes, Georgia, USA.. Smithsonian Environmental Research Center. Dataset. https://doi.org/10.25573/serc.24518755 | 30 January 2024 |
| Cifuentes-Jara et al. (2024) | Cifuentes-Jara, Miguel; Pérez, Christian Brenes; Manrow-Villalobos, Marilyn; Torres, Danilo (2024). Dataset: Land use dynamics and mitigation potential of the mangroves of the Gulf of Nicoya, Costa Rica. Smithsonian Environmental Research Center. Dataset. https://doi.org/10.25573/serc.24943866 |
29 January 2024 |
| Brown et al. (2024) | Brown, Cheryl A.; Mochon Collura, T Chris; DeWitt, Ted (2024). Dataset: Accretion rates and carbon sequestration in Oregon salt marshes. Smithsonian Environmental Research Center. Dataset. https://doi.org/10.25573/serc.25024448 | 23 January 2024 |
| Radabaugh et al. (2023) | R. Radabaugh, Kara; P. Moyer, Ryan; R. Chappel, Amanda; L. Breithaupt, Joshua; Lagomasino, David; E. Dontis, Emma; et al. (2023). A Spatial Model Comparing Above- and Belowground Blue Carbon Stocks in Southwest Florida Mangroves and Salt Marshes. Smithsonian Environmental Research Center. Dataset. https://doi.org/10.25573/serc.23960826 | 21 December 2023 |
| Radabaugh et al. (2021) | R. Radabaugh, Kara; E. Dontis, Emma; R. Chappel, Amanda; E. Russo, Christine; P. Moyer, Ryan (2023). Early indicators of stress in mangrove forests with altered hydrology in Tampa Bay, Florida, USA. Smithsonian Environmental Research Center. Dataset. https://doi.org/10.25573/serc.23960811 | 21 December 2023 |
| Radabaugh et al. (2018) | R. Radabaugh, Kara; P. Moyer, Ryan; R. Chappel, Amanda; E. Powell, Christina; Bociu, Ioana; C. Clark, Barbara; et al. (2023). Coastal Blue Carbon Assessment of Mangroves, Salt Marshes, and Salt Barrens in Tampa Bay, Florida, USA. Smithsonian Environmental Research Center. Dataset. https://doi.org/10.25573/serc.23960784 | 21 December 2023 |
| Radabaugh et al. (2017) | Radabaugh, Kara R.; E. Powell, Christina; Bociu, Ioana; C. Clark, Barbara; P. Moyer, Ryan (2023). Plant size metrics and organic carbon content of Florida salt marsh vegetation. Smithsonian Environmental Research Center. Dataset. https://doi.org/10.25573/serc.24602130 | 21 December 2023 |
| Dontis et al. (2020) | E. Dontis, Emma; Radabaugh, Kara R.; R. Chappel, Amanda; E. Russo, Christine; P. Moyer, Ryan (2023). Carbon Storage Increases with Site Age as Created Salt Marshes Transition to Mangrove Forests in Tampa Bay, Florida (USA). Smithsonian Environmental Research Center. Dataset. https://doi.org/10.25573/serc.24467947 | 21 December 2023 |
| Cifuentes-Jara and Manrow-Villalobos (2023) | Cifuentes-Jara, Miguel; Manrow-Villalobos, Marylin (2023). Dataset: Study of total economic valuation of the main services provided by mangroves in the Gulf of Chiriquí, Panama. Smithsonian Environmental Research Center. Dataset. https://doi.org/10.25573/serc.24294928 | 9 November 2023 |
| Shaw et al. (2023) | Shaw, Timothy; Cahill, Niamh; Barbieri, G; Ashe, E; S. Khan, Nicole; Brain, M; et al. (2023). Dataset: Relative sea-level change and driving processes during the past ~4000 years in the Chesapeake Bay, U.S. Atlantic Coast. Smithsonian Environmental Research Center. Dataset. https://doi.org/10.25573/serc.24526066 | 8 November 2023 |
| Beers et al. (2023) | Schile-Beers, Lisa M; Altieri, Andrew H.; Megonigal, J. Patrick (2023). Dataset: Mangrove, tidal wetland and seagrass soil carbon stocks along latitudinal gradients. Smithsonian Environmental Research Center. Dataset. https://doi.org/10.25573/serc.11971527 | 23 October 2023 |
| Costa et al. (2023) | Costa, Matthew T.; Ezcurra, Exequiel; Ezcurra, Paula; Salinas-de-León, Pelayo; Turner, Benjamin L.; Leichter, James; et al. (2023). Dataset: Sediment depth and accretion shape belowground mangrove carbon stocks across a range of climatic and geologic settings.. Smithsonian Environmental Research Center. Dataset. https://doi.org/10.25573/serc.21295716 | 12 July 2023 |
| Rovai et al. (2023) | Rovai, Andre; Twilley, Robert; Castaneda-Moya, Edward; Riul, Pablo; Cifuentes-Jara, Miguel; Manrow-Villalobos, Marilyn; et al. (2023). Dataset: Global controls on carbon storage in mangrove soils. Smithsonian Environmental Research Center. Dataset. https://doi.org/10.25573/serc.21295713 | 11 January 2023 |
| Morrissette et al. (2023) | Morrissette, Hannah; Baez, Stacy K.; Schile-Beers, Lisa M; Bood, Nadia; Martinez, Ninon D.; Novelo, Kevin; et al. (2023). Dataset: National total ecosystem carbon stock for the mangroves of Belize. Smithsonian Environmental Research Center. Dataset. https://doi.org/10.25573/serc.21298338 | 8 February 2023 |
| Weston et al. (2022) | Weston, Nathaniel B; Rodriguez, Elise; Donnelly, Brian; Solohin, Elena; Jezycki, Kristen; Demberger, Sandra; et al. (2022): Dataset: Recent Acceleration of Coastal Wetland Accretion Along the U.S. East Coast. Smithsonian Environmental Research Center. Dataset. https://doi.org/10.25573/serc.13043054 | 7 October 2022 |
| Allen et al. (2022) | Allen, Jenny R.; Cornwell, Jeffrey C; Baldwin, Andrew H. (2022): Dataset: Contributions of Organic and Mineral Matter to Vertical Accretion in Tidal Wetlands across a Chesapeake Bay Subestuary. Smithsonian Environmental Research Center. Dataset. https://doi.org/10.25573/serc.18130892 | 22 February 2022 |
| Fell et al. (2021) | Fell, Claire; Adgie, Therese; Chapman, Samantha (2021): Dataset: Carbon sequestration across Northeastern, Florida Coastal Wetlands. Smithsonian Environmental Research Center. Dataset. https://doi.org/10.25573/serc.15043920 |
3 December 2021 |
| Carlin et al. (2021) | Carlin, Joseph; Oikawa, Patty Y.; Arias-Ortiz, Ariane; Kanneg, Sadie; Duncan, Theresa; Beener, Katya (2021): Dataset: Sedimentary organic carbon measurements in a restored coastal wetland in San Francisco Bay, CA, USA. Smithsonian Environmental Research Center. Dataset. https://doi.org/10.25573/serc.16416684 | 1 November 2021 |
| Arias-Ortiz et al. (2021) | Arias-Ortiz, Ariane; Masqué, Pere; Paytan, Adina; Baldocchi, Dennis D. (2021): Dataset: Tidal and nontidal marsh restoration: a trade-off between carbon sequestration, methane emissions, and soil accretion. Smithsonian Environmental Research Center. Dataset. https://doi.org/10.25573/serc.15127743 | 1 November 2021 |
| Ensign et al. (2021) | Ensign, Scott H.; Noe, Gregory B.; Hupp, Cliff R.; Skalak, Katherine J. (2021): Dataset: Head of tide bottleneck of particulate material transport from watersheds to estuaries. Smithsonian Environmental Research Center. Dataset. https://doi.org/10.25573/serc.13483332 | 13 January 2021 |
| Piazza et al. (2021) | Piazza, S.C., Steyer, G.D., Cretini, K.F., Sasser, C.E., Visser, J.M., Holm, G.O., Sharp, L.A., Evers, E., and Meriwether, J.R., 2021, Geomorphic and ecological effects of Hurricanes Katrina and Rita on coastal Louisiana marsh communities: U.S. Geological Survey data release, https://doi.org/10.5066/P9D8WTQW | 5 January 2021 |
| St. Laurent et al. (2020) | Laurent, Kari A. St.; Hribar, Daniel J.; Carlson, Annette J.; Crawford, Calyn M.; Siok, Drexel (2020): Dataset: Assessing coastal carbon variability in two Delaware tidal marshes. The Smithsonian Institution. Dataset. https://doi.org/10.25573/serc.13315472.v1 | 4 December 2020 |
| Keshta et al. (2020) | Keshta, Amr E.; Yarwood, Stephanie A.; Baldwin, Andrew H. (2020): Dataset: Soil Redox and Hydropattern control Soil Carbon Stocks across different habitats in Tidal Freshwater Wetlands in a Sub-estuary of the Chesapeake Bay. The Smithsonian Institution. Dataset. https://doi.org/10.25573/serc.13187549.v1 | 30 November 2020 |
| Whigham et al. (2020) | Whigham, Dennis; Holmquist, James R; Ogburn, Matthew B.; Goodison, Michael; McFarland, Liza; Megonigal, Patrick (2020): Dataset: 2015-2018 USA-MDA TMON Marsh Biomass Surveys. The Smithsonian Institution. Dataset. https://doi.org/10.25573/serc.12636404.v1 | 14 October 2020 |
| Kauffman et al. (2020) | Boone Kauffman, J.; Giovannoni, Leila R.; Kelly, James; Dunstan, Nicholas; Borde, Amy; Diefenderfer, Heida; et al. (2020): Dataset: Carbon stocks in seagrass meadows, emergent marshes, and forested tidal swamps of the Pacific Northwest. The Smithsonian Institution. Dataset. https://doi.org/10.25573/serc.12640172.v2 | 11 August 2020 |
| Sanborn and Coxson (2020) | Sanborn, Paul; Coxson, Darwyn S. (2020): Dataset: Carbon data for intertidal soils and sediments, Skeena River estuary, British Columbia. The Smithsonian Institution. Dataset. https://doi.org/10.25573/serc.12252005.v1 | 15 June 2020 |
| Lagomasino et al. (2020) | Lagomasino, David; Corbett, D. Reide; Walsh, J.P. (2020): Dataset: Influence of Wind-Driven Inundation and Coastal Geomorphology on Sedimentation in Two Microtidal Marshes, Pamlico River Estuary, NC. The Smithsonian Institution. Dataset. https://doi.org/10.25573/serc.12043335.v1 | 27 March 2020 |
| Nolte et al. (2020) | Nolte, Stefanie (2020): Dataset: Does livestock grazing affect sediment deposition and accretion rates in salt marshes?. The Smithsonian Institution. Dataset. https://doi.org/10.25573/serc.11958996.v1 | 20 March 2020 |
| Buffington et al. (2020) | Buffington, Kevin; Janousek, Christopher; Thorne, Karen; Dugger, Bruce (2020): Dataset: Carbon stocks and accretion rates for wetland sediment at Miner Slough, Sacramento-San Joaquin Delta, California. The Smithsonian Institution. Dataset. https://doi.org/10.25573/serc.11968740.v1 | 19 March 2020 |
| Messerschmidt et al. (2020) | Messerschmidt, Tyler C.; Kirwan, Matthew L. (2020): Dataset: Soil properties and accretion rates of C3 and C4 marshes at the Global Change Research Wetland, Edgewater, Maryland. The Smithsonian Institution. Dataset. https://doi.org/10.25573/serc.11914140.v1 | 3 March 2020 |
| Vaughn et al. (2020) | Vaughn, Derrick; Bianchi, Thomas; Shields, Michael; Kenney, William; Osborne, Todd (2020): Dataset: Increased Organic Carbon Burial in Northern Florida Mangrove-Salt Marsh Transition Zones. The Smithsonian Institution. Dataset. https://doi.org/10.25573/serc.10552004 | 2 March 2020 |
| Peck et al. (2019) | Peck, Erin; Wheatcroft, Robert; Brophy, Laura (2019): Dataset: Controls on sediment accretion and blue carbon burial in tidal saline wetlands: Insights from the Oregon coast, U.S.A.. The Smithsonian Institution. Dataset. https://doi.org/10.25573/serc.11317820.v2 | 24 January 2020 |
| Breithaupt et al. (2020) | Breithaupt, Joshua L.; Smoak, Joseph M.; Bianchi, Thomas S.; Vaughn, Derrick; Sanders, Christian J.; Radabaugh, Kara R.; et al. (2020): Dataset: Increasing rates of carbon burial in southwest Florida coastal wetlands. The Smithsonian Institution. Dataset. https://doi.org/10.25573/serc.9894266.v1 | 22 January 2020 |
| Kemp et al. (2020) | Kemp, Andrew C.; Sommerfield, Christopher K.; Vane, Christopher H.; P. Horton, Benjamin; Chenery, Simon; Anisfeld, Shimon; et al. (2020): Dataset: Use of lead isotopes for developing chronologies in recent salt-marsh sediments. figshare. Dataset. https://doi.org/10.25573/serc.11569419.v1 | 16 January 2020 |
| McTigue et al. (2020) | McTigue, Nathan; Davis, Jenny; Rodriguez, Antonio; McKee, Brent; Atencio, Anna; Currin, Carolyn (2020): Dataset: Carbon accumulation rates in a salt marsh over the past two millennia. figshare. Dataset. https://doi.org/10.25573/serc.11421063.v1 | 10 January 2020 |
| Breithaupt et al. (2019) | Breithaupt, Joshua L.; Smoak, Joseph M.; Sanders, Christian J.; Smith III, Thomas J. (2019): Dataset: Temporal variability of carbon and nutrient burial, sediment accretion, and mass accumulation over the past century in a carbonate platform mangrove forest of the Florida Everglades. figshare. Dataset. https://doi.org/10.25573/serc.11310926.v1 | 20 December 2019 |
| Coastal Wetland Elevation and Carbon Flux Inventory with Uncertainty, USA, 2006-2011 (Associated Paper here) | Holmquist, J.R., L. Windham-Myers, B. Bernal, K.B. Byrd, S. Crooks, M.E. Gonneea, N. Herold, S.H. Knox, K. Kroeger, J. Mccombs, P.J. Megonigal, L. Meng, J.T. Morris, A.E. Sutton-grier, T. Troxler, and D. Weller. 2019. Coastal Wetland Elevation and Carbon Flux Inventory with Uncertainty, USA, 2006-2011. ORNL DAAC, Oak Ridge, Tennessee, USA. https://doi.org/10.3334/ORNLDAAC/1650 | 17 December 2019 |
| Thom (2019) | Thom, Ronald M. (2019): Dataset: Accretion rates of low intertidal salt marshes in the Pacific Northwest. figshare. Dataset. https://doi.org/10.25573/data.10046189.v2 | 13 November 2019 |
| Belshe et al. (2019) | Belshe, E. Fay; Sanjuan, Jose; Leiva-Dueñas, Carmen; Piñeiro-Juncal, Nerea; Serrano, Oscar; S. Lavery, Paul; et al. (2019): Dataset: Modeling organic carbon accumulation rates and residence times in coastal vegetated ecosystems. figshare. Dataset. https://doi.org/10.25573/data.9856769.v1 | 01 November 2019 |
| Abbott et al. (2019) | Abbott, Katherine M; Quirk, Tracy; Delaune, Ronald D. (2019): Dataset: Factors influencing blue carbon accumulation across a 32‐year chronosequence of created coastal marshes. figshare. Dataset. https://doi.org/10.25573/data.10005215.v1 | 01 November 2019 |
| Poppe and Rybczyk (2019) | Poppe, Katrina L; Rybczyk, John M (2019): Dataset: Sediment carbon stocks and sequestration rates in the Pacific Northwest region of Washington, USA. figshare. Dataset. https://doi.org/10.25573/data.10005248.v1 | 24 October 2019 |
| The Coastal Carbon Network - Below Ground Survey | This is a web interface we designed with the goal of surveying best educated guesses on how key below ground plant traits and decay rates vary for tidal wetlands. The app uses a formal expert elicitation protocol and feedback will be pooled to inform the modeling effort of our soils working group. | 21 October 2019 |
| Boyd et al. (2019) | Boyd, Brandon; Sommerfield, Christopher K.; Quirk, Tracy; Unger, Viktoria (2019): Dataset: Accretion and sediment accumulation in impounded and unimpounded marshes in the Delaware Estuary and Barnegat Bay. figshare. Dataset. https://doi.org/10.25573/data.9747065.v1 | 03 September 2019 |
| Callaway et al. (2019) | Callaway, John C.; Borgnis, Evyan L.; Turner, R. Eugene; Milan, Charles S. (2019): Dataset: Carbon sequestration and sediment accretion in San Francisco Bay tidal wetlands. figshare. Dataset. https://doi.org/10.25573/data.9693251.v1 | 03 September 2019 |
| Doughty et al. (2019) | Doughty, Cheryl; Langley, J. Adam; Walker, Wayne; Feller, Ilka C.; Schaub, Ronald; Chapman, Samantha (2019): Mangroves marching northward: the impacts of rising seas and temperatures on ecosystems at Kennedy Space Center. figshare. Dataset. https://doi.org/10.25573/data.9695918.v1 | 26 August 2019 |
| The Coastal Carbon Atlas | Use this web interface to visualize, query, and download data from the Coastal Carbon Clearinghouse. | 22 February 2019 |
| Tidal Wetland Soil Carbon Stocks for CONUS | This dataset provides modeled estimates of soil carbon stocks for tidal wetland areas of the Conterminous United States (CONUS) for the period 2006-2010. | 20 February 2019 |
| Accuracy and Precision of Tidal Wetland Soil Carbon Mapping (associated paper here) | Per-depth soil organic matter and carbon metrics, plant species identity, state of human impact, field and lab methodology, and metadata of 1534 soil cores | 21 June 2018 |
| Coastal National Greenhouse Gas Inventory: Report, Datasets, and Workflow | Literature review, data, analysis, and report | 9 December 2017 |
Testimonials to Data Contribution
“The Coastal Carbon Research Coordination Network dataset has been invaluable in our recent research identifying global drivers of variability in coastal wetland carbon cycling. The Network’s dataset greatly complemented our own previous data collation efforts, filling important gaps in our record. The availability of a comprehensive and well-curated dataset allowed us to focus on the analysis and interpretation of data, deriving important new insights in global patterns of carbon storage.”
- Jeffrey Kelleway, Department of Environmental Sciences, Macquarie University
"The CCRCN database is a key cornerstone in accelerating the pace of discovery for coastal carbon cycling. I recently downloaded version 1, and have begun analylzing it and intercomparing its features with other national and global sets on soil core characteristics. As it focuses only on soilcores from tidal wetland, it is the single largest and spatially explicit empirical dataset, globally, for populating carbon stock assessments or testing models across space and time. For coastal lands, it is an invaulable asset for scientists and managers alike. The developers of the dataset and platform should be commended, as should the many community contributors who are fueling advances in science and practice by sharing their data."
"[The CCRCN administrators] are doing an amazing job at this organization and promoting inclusivity. I am floored by your intuition and abilities. You are the natural heirs to this community-building."
- Lisamarie Windham-Myers, U.S. Geological Survey
Data Management Plan
Contents
Types of Data
The Coastal Carbon Network (CCN) recognizes three classes of data: (i) data that we curate, (ii) data that we ingest, and (iii) synthesis products we create. Data that we curate will be hosted on Smithsonian Institution (SI) servers, but the original data submitter and funding sources will be credited as the dataset’s creators. Data that we ingest will include both data we curate and data from any outside sources that meet basic availability, archiving, and metadata standards. These data will be pulled into intermediate files in a centralized database using R code. The workflow and files will be archived and publicly available on an SI-managed GitHub website. This document refers to soil depth profile data throughout, but it is our intention that these general structures and principles be applied to other types of data as the Network evolves.
Digital Object Identifiers
We encourage submitters to use best practices and to assign datasets a citable digital object identifier (DOI), which links to a repository containing downloadable data and associated metadata. We will prioritize ingesting such data into the synthesis. Data submitters can choose to forward DOIs issued outside of the Network for ingestion into the central data structure on the Network’s SI GitHub website. Some DOI-issuing repository services include Figshare and the Environmental Data Initiative. As a service to the community Network personnel can will be available to assist data submitters in archiving data according to outlined standards.
Submitters also have the option to host data on an SI server, and apply for a DOI through SI libraries, with the submitters credited as a dataset author and Network personnel credited for their curatorial role. Landing pages with summaries of projects, sites, and cores will be viewable on Dspace, and the CCN website will advertise a link to the data release. While data will be digitally archived long-term in accordance with SI standards, we cannot guarantee new data will be accepted after Network funding ends.
While we recognize that there is no official definition for what constitutes a trusted repository, repositories associated with DOIs should in general have community recognition and trust in their long-term stability. For data curated by the Network we hope that SI’s reputation, DSpace’s status as an approved technology, and the SIL’s commitment to digital object curation, generate this level of community trust.
Metadata Standards
For data curated by the Network, we will use the Environmental Metadata Language standards. This includes an abstract, detailed submitter information, attribute definitions, and data types (e.g. character, factor, numeric, or dateTime). CCN personnel will use the R-based EML package in our workflow to create metadata for data that we curate. Code used to create EML will be documented, and archived in a Smithsonian GitHub repository.
Attribute Names
Attribute names (analogous to column names in a spreadsheet) should follow good management practices1. Attribute names should be self descriptive and machine readable. They should contain no spaces and must not begin with a number or special character; however, underscores (i.e. pothole_case) are acceptable. We will recommend and adopt controlled vocabulary for attribute naming. Any submitter defined attributes should follow the same naming principles and documentation.
Units for all attributes need to be defined and in some cases controlled. For some variables which typically have commonly reported units we will recommend submitters format using these controlled units. These include fraction_organic_matter (fraction), dry_bulk_density (g cm-3) and latitude and longitude (decimal degrees [world geographic survey 1984]). For attributes that are applicable to the synthesis, but typically have multiple common unit formats, we recommend an accompanying column defining these units. Uncommon data types, or data types not included in synthesis projects, simply need to have units defined in associated metadata.
Good data practices require consistently formatting no data values and categorical variables. We have adopted the R-based convention of representing no data values as NA for all variable types (never blanks). Categorical variables should have descriptive names stored as text, similar to attribute names. For example, one may code the categorical variable treatments as numeric values 0 and 1 standing in for experimental and control; however, best practices would dictate coding these as descriptive characters (experimental and control) rather than numbers.
For data we curate we will use controlled vocabulary units and variable types. For data we ingest, we will keep a file of corresponding controlled variables and aliases so that data not complying with controlled vocabulary can still be ingested. We will document transformations made to ingested data to standardize them with the data we curate in R code.
Proposed Level of Disaggregation
In general we believe that there should be community agreement on the finest level of data disaggregation archived for practical use and reuse. This fundamental unit should be the most detailed unit typically used and reported in the literature. For soils data we will stratify by site, by core, and by depth increment. For calculations such as loss-on-ignition and bulk density, data by depth increment will be the fundamental level of archiving. For age-depth information we will archive radiocarbon (14C) age ? sd of a sample for 14C dates, and counts per unit dry weight ? sd of a sample for 210Pb and 137Cs profiles.
Hierarchical Structure
We will ingest existing data and curate submitted data in a hierarchical framework. Information associated with submitters, projects, sites, cores, and depth profiles will all be hosted in separate tables related by index codes that are unique. A universal dataset index will be composed of the principal investigator’s family name, as well as the second author or ‘et al’ in the case of more than two authors, then the publication year. Sequential letters will be added to the end (a,b,c, etc.) in case of multiple publications per year (Example: Jane Doe, Lee Fakeman and Ben Mademup’s 2009 paper = Doe_et_al_2009).
Project metadata will have an abstract and information about coauthors, associated funding source, or set of funding sources, associated publications, and materials and methods. A project should be a discrete unit of research united by consistent personnel, funding sources, and/or materials and methods. A project can be associated with one or more sites.
Sites refer to discrete geographic or management units and are somewhat nebulous, project specific, and submitter defined. A site code should follow the same best practices for variable naming: not starting with a number, descriptive, brief, and meaningful to project documentation and design. Site metadata refer to data associated with the sites, such as location, notes on dominant vegetation types, salinity, and site condition. Although there are no standards for what constitutes a site, and different projects could have different names for the same site, this coding should be consistent within a project. A site can have one or more data sets, including one or more core, plot, or instrument locations.
Core/Plot/Instrument-Level Data refer to information specifically about the location of a soil core. This could include positional information such as latitude, longitude, and elevation. It could also include notes that are redundant but more detailed than site metadata, such as vegetation and salinity. Each core should have a unique code within a project. A core code should follow the same best practices for variable naming: not starting with a number, descriptive, brief, and meaningful to project documentation and design. For future syntheses this level of hierarchy could also house other types of data such as vegetation plots or instruments.
Depth Series Information: Soil cores have depth-series information which should include minimum and maximum depth increments, as well as measurements presented in their fundamental unit (explained above), with associated methods notes, and uncertainties. If replicate samples are taken from the same depth increment then these can be distinguished with a sample code. These can be submitter defined, but should conform to general principles for variable naming. In future syntheses time-series data could also be archived in this format with instrument replacing a core, and time replacing depth.
Data Storage
Tabular data will be stored in a flat text file, meaning that no data formatting will be included. We will default to using tab-delimited text files (.txt) for simplicity. Although comma separated values .csv are also common, these types of files can be corrupted if commas are ever used within a variable rather than to delineate variables. Submissions that are received in other formats, such Microsoft Excel files, will be edit-locked and archived as submission documents. However, a working version of this submission will be formatted according to Network standards in flat text files.
Tabular data will be stored in long-form tables, as opposed to wide-form tables. Each column should correspond to one variable, each row should correspond to one entry. Each column needs to have a single data type, and represent only one variable. Extra information such as units, notes, or operator code will not be encoded as an excel note, cell color, or be included in the same cell as a value.
Quality Control
Network personnel will perform a cursory visual check on all data we curate and relay any concerns to the data submitter during the curation process. We will also write scripts to check data type, to check that values for each attribute are in defined bounds if applicable (such as 0 to 1 for fractions), to check for completeness, and to ensure there are no conflicts or duplicates with previously archived data. For data that we curate, files will be edit-locked following QA:QC. Any updates or corrections will result in a new named version of the file, a change logged by Network personnel in a text file associated with the data, and a note of the change sent to the next update of the Network email list members.
Submitting Data
If you are interested in submitting data, please email CoastalCarbon@si.edu and CCN personnel will assist you in the process. We are working on building a webportal to automate a lot of this exchange, but until we do so this will remain a very friendly peer to peer handoff system. Data submissions can remain embargoed for a time specified by the submitter. In embargo cases a data release will be prepared and shared with the submitter via a private dropbox link, until the embargo period ends, the data release is made public, and the dataset is drawn into synthesis products.
-
Wilson G, Bryan J, Cranston K, Kitzes J, Nederbragt L, Teal TK (2017) Good enough practices in scientific computing. PLoS Comput Biol 13(6): e1005510. https://doi.org/10.1371/journal.pcbi.1005510↩
Data Products
Data Products
The Network recognizes three classes of data: (i) data that we curate, (ii) data that we ingest, and (iii) synthesis products we create. Data that we curate will be hosted on Smithsonian Institution (SI) servers, but the original data submitter and funding sources will be credited as the dataset’s creators. Data that we ingest will include both data we curate and data from any outside sources that meet basic availability, archiving, and metadata standards.
See below for a list of CCRCN data products.
Dataset |
Data Components |
Last Updated |
|---|---|---|
| Accuracy and Precision of Tidal Wetland Soil Carbon Mapping (associated paper here) | Per-depth soil organic matter and carbon metrics, plant species identity, state of human impact, field and lab methodology, and metadata of 1534 soil cores | 21 June 2018 |
| Coastal National Greenhouse Gas Inventory: Report, Datasets, and Workflow | Literature review, data, analysis, and report | 9 December 2017 |
Testimonials to Data Contribution
“The Coastal Carbon Research Coordination Network dataset has been invaluable in our recent research identifying global drivers of variability in coastal wetland carbon cycling. The Network’s dataset greatly complemented our own previous data collation efforts, filling important gaps in our record. The availability of a comprehensive and well-curated dataset allowed us to focus on the analysis and interpretation of data, deriving important new insights in global patterns of carbon storage.”
- Jeffrey Kelleway, Department of Environmental Sciences, Macquarie University
"The CCRCN database is a key cornerstone in accelerating the pace of discovery for coastal carbon cycling. I recently downloaded version 1, and have begun analylzing it and intercomparing its features with other national and global sets on soil core characteristics. As it focuses only on soilcores from tidal wetland, it is the single largest and spatially explicit empirical dataset, globally, for populating carbon stock assessments or testing models across space and time. For coastal lands, it is an invaulable asset for scientists and managers alike. The developers of the dataset and platform should be commended, as should the many community contributors who are fueling advances in science and practice by sharing their data."
- Lisamarie Windham-Myers, U.S. Geological Survey
Database Structure
Naming Conventions for Attributes and Variables (Version 1)
3 July 2018
Contents
Overview
This page serves as guidance for the types and scope of data and metadata that will be archived as part of the Network’s developing tidal soil carbon synthesis. We propose the following data structure and standardized attribute names for metadata and data in order to make datasets machine-readable and interoperable. Each subheading lists a level of metadata or data hierarchy from study level metadata to site level to core level to depth series information. Each subheading also represents separate tables which can be joined by common attributes such as study_id, site_id, and core_id. We also include accompanying sets of recommended controlled vocabulary for key categorical variables (also known as factors). Some attributes have controlled units that we wish to keep uniform across datasets. Data that we curate will follow naming conventions outlined herein. Data that we ingest from outside sources will be converted to these conventions when being ingested into the central GitHub database using custom-built R scripts.
At a minimum a submission should have the following for inclusion in soil carbon synthesis products: study_id, author information, core_id, latitude and longitude information associated with either a core or the site, depth_min, depth_max, dry_bulk_density, organic_matter_fraction and/or carbon_fraction. The more auxiliary detail that you provide, the more widely your data can be used. Throughout the tables below mandatory attributes are shown in bold.
The depth series is the level at which carbon-relevant information is housed. This synthesis will not ingest core-level or site-level averages of variables like dry bulk density, fraction organic matter, or fraction carbon. These averages can be derived from the database, but are not immediately useful to our research questions unless those averages can be traced back to their original data.
There are many opportunities to express your data’s individuality. We refer throughout to ‘flags’ and ‘notes’. Flags refer to common methodological choices or data issues that can be coded using categorical variables. The idea behind flags is to allow users the option to query datasets based on methodology. Flags are very machine-readable but not very flexible from the standpoint of a submitter. Notes are available for almost all measured attributes and take the form of free-text allowing submitters to provide context, observations, or concerns about methods, sites, cores, or observations. These are more flexible from the perspective of a submitter but are less machine-readable.
Development Process to Date
This guidance is the culminations of three efforts:
-
A meeting of 47 experts in Menlo Park, CA in January 2016, hosted by the United States Carbon Cycle Science Program, in order to establish community priorities.
-
Experience with the initial curation of a dataset of ~1,500 public soil cores as part of the publication Holmquist et al., 2018 Accuracy and Precision of Tidal Wetland Soil Carbon Mapping in the Conterminous United States.
-
The results of 19 collaborators submitting commentary on an initial draft of these recommendations put up for public comment in April and May 2018.
Ongoing and Future Development
We acknowledge that this is a lot of information to process and do not want to imply >100 attributes are mandatory. They are not. While the entire entry template is available for download , we are also in the process of designing an application which will generate a custom submission template based on your answers to a questionnaire about your dataset.
Submitters can feel free to add other attributes to data submissions as long as the attributes and any associated categorical variables are defined with the submission. CCRCN personnel will accept and archive related soils data within reason, but will not be able to quality control data falling outside the outlined guidance. If attributes or variables are submitted often and there is community coordination behind their inclusion, they could be integrated into periodic updates to this guidance.
We anticipate that this guidance will evolve as we synthesize new datasets as part of five working groups. Part of each working group’s task will be to revisit this guidance and agree on new needed attribute names, definitions, variables, controlled vocabulary and units. Any further guidance based on the working group’s experience will be made available to the community via post-workshop reports and peer reviewed publications. Documentation on any changes to the data management plan and submission templates will be issued with version numbers. CCRCN produces will reference these documents and version numbers. We will avoid changing attribute or variable names, and will only do so if there is a compelling reason to. If in the future there ends up being more than one acceptable redundant attribute or variable name, names will be added to a database of synonyms and working synthesis products will be updated given the most current standards.
Study Level Metadata
Study-level information is essential for formatting the Ecological Metadata Language, and is a great way for you to express your project’s history, context, and originality.
Study Information
Please provide some custom text for your study.
| attribute name | definition | data type | format, unit or codes |
|---|---|---|---|
| study_id | Unique identifier for the study made up of the first author’s family name, as well as the second author’s family name or ‘et al.’ if more than three, then publication year spearated by underscores. | character | |
| one_liner | If this is data the CCRCN curates, the submitter should include a one line description of the study. | character | |
| study_code | If this is data the CCRCN curates, the study will be assigned a 128-bit universal unique identifier. Submitters should only include this if it already exists for the data. Otherwise CCRCN personnel will generate this as part of the data ingestion process. | character | |
| study_start_date | Study start date. | Date | YYYY-MM-DD |
| study_end_date | Study end date. | Date | YYYY-MM-DD |
| title | If this is data the CCRCN curates, the submitter should include a study title. If this is data the CCRCN is ingesting, this can be pulled from the metadata or source text. | character | |
| abstract | If this is data the CCRCN curates, the submitter should include a one paragraph description of the study. If this is data the CCRCN is ingesting, this can be pulled from the metadata or source text. | character |
Keywords
Keywords are not necessary, but can help make your data more searchable in a database.
| attribute name | definition | data type | format, unit or codes |
|---|---|---|---|
| study_id | Unique identifier for the study made up of the first author’s family name, as well as the second author’s family name or ‘et al.’ if more than three, then publication year spearated by underscores. | character | |
| key_words | If this is data the CCRCN curates, the submitter should include five to fifteen descriptive words or phrases describing the study. If this is data the CCRCN is ingesting, this can be pulled from the metadata or source. Keywords help build some search functionality into the databases. | character |
Authors
For each dataset at least one corresponding author should be specified. Specifying author names will allow users (or you in the future) to query the dataset and see how many cores you’ve submitted.
| attribute name | definition | data type | format, unit or codes |
|---|---|---|---|
| study_id | Unique identifier for the study made up of the first author’s family name, as well as the second author’s family name or ‘et al.’ if more than three, then publication year separated by underscores. | character | |
| last_name | Submitter’s family name. | character | |
| given_name | Submitter’s first name, middle name, middle initial, or any other names. | character | |
| institution | Submitter’s current institution. | character | |
| Submitter’s current email address. | character | ||
| address | Submitter’s current mailing address. | character | |
| phone | Submitter’s current phone number. | character | |
| corresponding_author | TRUE or FALSE indicating whether the author should be contacted as the corresponding author. | factor | TRUE = The author should be contacted with any further questions. FALSE = The author should not be contacted with any further questions. |
Funding Sources
Your funders will love being acknowledged in a data release, and will appreciate being searchable in the database. One dataset can have multiple funding sources.
| attribute name | definition | data type | format, unit or codes |
|---|---|---|---|
| study_id | Unique identifier for the study made up of the first author’s family name, as well as the second author’s family name or ‘et al.’ if more than three, then publication year separated by underscores. | character | |
| funding_agency | Agency name funding the research, spelled out, no acronyms. | character | |
| funding_id | Code used by the agency to track the project funding. | character | |
| funding_notes | Any other submitter-generated notes about the project funding. | character |
Associated Publications
One dataset can be affiliated with multiple publications. This allows an original work to be cited as a primary source, as well as any secondary or synthesis papers that added value to the dataset’s archival. Submitters can simply add a bibtex style citation, such as one copied over from Google Scholar, or they can fill out all of the relevant attributes for the data release. It’s all the same to us. Much of this guidance came from the Wikipedia page for BibTeX.
| attribute name | definition | data type | format, unit or codes |
|---|---|---|---|
| study_id | Unique identifier for the study made up of the first author’s family name, as well as the second author’s family name or ‘et al.’ if more than three, then publication year separated by underscores. | character | |
| bibtex_citation | Submitters can associate multiple BibTeX style citations with the dataset. They can also include the same information by filling out following attributes in tabular form if more convenient than BibTeX formatting. | character | |
| publication_type | Code indicating the type of publication the study originates from. | factor | article = Journal article. book = Book. mastersthesis = Master’s Thesis. misc = Miscellaneous publications such as online datasets. phdthesis = PhD thesis or dissertation. techreport = Technical report. unpublished = Unpublished source. |
| author | The names of the author separated by “and”. | character | |
| year | The year of publication or, if unpublished, the year of creation. | Date | YYYY |
| title | The title of the work. | character | |
| journal | The journal or magazine the work was published in. | character | |
| volume | The volume of a journal or multi-volume book. | character | |
| number | The “(issue) number” of a journal, magazine, or tech-report, if applicable. (Most publications have a “volume”, but no “number” field.). | character | |
| pages | Page numbers, separated either by commas or double-hyphens. | character | |
| url | Permanent web address where the work can be located. | character | |
| doi | Digital object identifier associated with the work. | character | |
| address | Publisher’s address (usually just the city, but can be the full address for lesser-known publishers). | character | |
| annote | An annotation for annotated bibliography styles (not typical). | character | |
| booktitle | The title of the book, if only part of it is being cited. | character | |
| chapter | The chapter number. | character | |
| crossref | The key of the cross-referenced entry. | character | |
| edition | The edition of a book, long form (such as “First” or “Second”). | character | |
| editor | The name(s) of the editor(s). | character | |
| howpublished | How it was published, if the publishing method is nonstandard. | character | |
| institution | The institution that was involved in the publishing, but not necessarily the publisher. | character | |
| key | A hidden field used for specifying or overriding the alphabetical order of entries (when the “author” and “editor” fields are missing). Note that this is very different from the key (mentioned just after this list) that is used to cite or cross-reference the entry. | character | |
| month | The month of publication (or, if unpublished, the month of creation). | Date | MM |
| note | Miscellaneous extra information. | character | |
| organization | The conference sponsor. | character | |
| publisher | The publisher’s name. | character | |
| school | The school where the thesis was written. | character | |
| series | The series of books the book was published in (e.g. “The Hardy Boys” or “Lecture Notes in Computer Science”). | character | |
| type | The field overriding the default type of publication (e.g. “Research Note” for techreport, “{PhD} dissertation” for phdthesis, “Section” for inbook/incollection). | character |
Materials and Methods
For each study please fill out key data regarding materials and methods that are important to the soil carbon stocks meta-analysis. Some users may want to include or exclude certain methodologies, or see your commentary on the methods. Let’s make it easy for them.
| attribute name | definition | data type | format, unit or codes |
|---|---|---|---|
| study_id | Unique identifier for the study made up of the first author’s family name, as well as the second author’s family name or ‘et al.’ if more than three, then publication year separated by underscores. | character | |
| coring_method | Code indicating what type of device was used to collect soil depth profiles. | factor | gouge auger = A half cylinder coring device in which the coring section is open, not sealed off by a fin. hargas corer = A large diameter (>10 cm) coring device consisting of a tube, piston, and a cutting head. mcauley corer = A half cylinder coring device with the coring section sealed off by a fin attached to a rotating pivot point. mccaffrey peat cutter = U-shaped blade that extracts a core by cutting down through peat. none specified = No coring device was specified. other shallow corer = Any other type of coring device typically taking cores shallower than 30 centimeters. piston corer = A device that extrudes core into tube upward with a plunger. push core = Any number of coring types involving driving a tube into the sediment to recover a core. pvc and hammer = PVC pipe was driven into the sediment with a hammer to recover a core. russian corer = A half cylinder coring device with the coring section sealed off by a fin attached to a rotating pivot point. vibracore = A technique involving collecting a core by sinking a continuous pipe into sediment attaching a source of vibration, then recovering using a winch and pulley. surface sample = A technique involving collecting a core shallower than ~5 cm using a circular metal cutter. |
| roots_flag | Code indicating whether live roots were included or excluded from carbon assessments. | factor | roots and rhizomes included = Roots and rhizomes were included in dry bulk density and or organic matter and carbon measurements. roots and rhizomes separated = Roots and rhizomes were separated from soil before dry bulk density and or organic matter and carbon measurements. |
| sediment_sieved_flag | Code indicating whether or not sediment was sieved prior to carbon measurements. | factor | sediment sieved = Sediment was sieved prior to analysis for organics. sediment not sieved = Sediment was not sieved prior to analysis for organics. |
| sediment_sieve_size | If sediment was sieved, the size of sieve used. | numeric | millimeters |
| compaction_flag | Code indicating how the authors qualified or quantified compaction of the core. | factor | compaction qualified = Compaction was at least qualified and noted by the authors. compaction quantified = Compaction was quantified and corrected for in core based measurements. corer limits compaction = Authors specified that the coring device’s design minimized compaction. no obvious compaction = Authors observed no obvious compaction. not specified = Compaction was not specified. |
| dry_bulk_density_temperature | Temperature at which samples were dried to measure dry bulk density. This can include either samples that were freeze dried or oven dried. | numeric | celsius |
| dry_bulk_density_time | Time over which samples were dried to measure dry bulk density. | numeric | hour |
| dry_bulk_density_sample_volume | Sample volume used for bulk density measurements, if held constant. | numeric | cubicCentimeters |
| dry_bulk_density_sample_mass | Sample mass used for bulk density measurements, if held constant. | numeric | grams |
| dry_bulk_density_flag | Any notable codes regarding how the authors quantified dry bulk density. | factor | air dried to constant mass = Methodology specified that samples were air dried to a constant mass. modeled = Bulk density was not measured, but was modeled from loss on ignition and assumptions about the particle densities of organic and inorganic matter. freeze dried = Bulk density was measured on freeze dried samples. not specified = No additional details regarding bulk density methodology were provided. removed non structural water = Bulk density methodology did not specify drying temperature or length, only that non-strucural water was removed. time approximate = Bulk density time recorded herin is an approximate estimate. to constant mass = Bulk density methodology did not specify drying temperature or length, only that samples were dried to a constant mass. |
| loss_on_ignition_temperature | Temperature at which samples were combusted to estimate fraction organic matter. | numeric | celsius |
| loss_on_ignition_time | Time over which samples were combusted to estimate fraction organic matter. | numeric | hour |
| loss_on_ignition_sample_volume | Sample volume used for loss on ignition, if held constant. | numeric | cubicCentimeters |
| loss_on_ignition_sample_mass | Sample mass used for loss on ignition, if held constant. | numeric | grams |
| loss_on_ignition_flag | Common codes regarding loss on ignition methodology. | factor | time approximate = Loss on ignition time recorded herein is an approximate estimate. not specified = No additional details regarding loss on ignition methodology or time were provided. |
| carbon_measured_or_modeled | Code indicating whether fraction carbon was measured or estimated as a function of organic matter. | factor | measured = Fraction carbon was measured as opposed to modeled. modeled = Fraction carbon was modeled as opposed to measured. |
| carbonates_removed | Whether or not carbonates were removed prior to calculating fraction organic carbon. | factor | FALSE = Carbonates were not removed before measuring organic carbon. TRUE = Carbonates were removed before measuring organic carbon. |
| carbonate_removal_method | The method used to remove carbonates prior to measuring fraction carbon. | factor | direct acid treatment = Carbonates were removed using direct application of dilute acid. acid fumigation = Carbonates were removed by fumigating with concentrated acid. low carbonate soil = Organic carbon fraction was measured without removing carbonates assuming carbonate content of the soil type was minimal. carbonates not removed = Carbonates were not removed and low carbonate soil was not specified. none specified = Carbonate removal methodology was not specified. |
| fraction_carbon_method | Code indicating the method for which fraction carbon was measured or modeled (Note: regression based models are permitted, but the use of the Bemmelen factor [0.58 gOC gOM-1] is discouraged). | factor | Craft regression = Used regression model from Craft et al., 1991, Estuaries, to predict fraction carbon as a function of fraction organic matter. EA = Each sample presented was measured using Elemental Analysis. Fourqurean regression = Used regression model from Fourqurean et al., 2012, Nature Geoscience, to predict fraction carbon as a function of fraction organic matter. Holmquist regression = Used regression model from Holmquist et al., 2018, Scientific Reports, to predict fraction carbon as a function of fraction organic matter. kjeldahl digestion = Each sample was measured kjeldahl digestion method. local regression = A regression model fit using a subset of measurements was used to predict fraction carbon as a function of fraction organic matter. not specified = No additional details were provided regarding fraction carbon methodologies. wet oxidation = Each sample was measured using a wet oxidation method. |
| fraction_carbon_type | Code indicating whether fraction_carbon refers to organic or total carbon. | factor | organic carbon = Author specified that fraction carbon measurements were of organic carbon. total carbon = Author specified that fraction carbon measurements were of total carbon. |
| carbon_profile_notes | Any other submitter defined notes describing methodologies for determining dry bulk density, organic matter fraction, and carbon fraction. | character | |
| cs137_counting_method | Code indicating the method used for determining radiocesium activity. | factor | alpha = Alpha counting method used. gamma = Gamma counting method used. |
| pb210_counting_method | Code indicating the method used for determining lead 210 activity. | factor | alpha = Alpha counting method used. gamma = Gamma counting method used. |
| excess_pb210_rate | Code indicating the mass or accretion rate used in the excess_pb_210_model | factor | mass accumulation = Excess 210Pb modeled using mass accumulation rate. accretion = Excess 210Pb modeled using vertical accretion rate. |
| excess_pb210_model | Code indicating the model used to estimate excess lead 210. | factor | CRS = Constant rate of supply model used. CIC = Constant initial concentration model used. CFCS = Constant flux constant sedimentation model used. |
| ra226_assumption | Code indicating the assumption used to estimate the core’s background 226Ra levels. | factor | each sample = 226Ra was measured for each sample. total core = 226Ra was measured for the total core, at asymptote = asy |
| c14_counting_method | Code indicating the method used for determining radiocarbon activity. | factor | AMS = Accelerator mass spectroscopy used. beta = Beta counting used. |
| dating_notes | Any submitter defined notes elaborating on the process of dating the core not yet made clear by the coding. | character | |
| age_depth_model_reference | Code indicating the reference or 0 year of the age depth model. | factor | YBP = Year zero is defined as years before present, 1960 CE. CE = Year zero is set according to Common Era and Before Common Era standards. core collection date = Year zero is set as the core’s collection year. |
| age_depth_model_notes | Any submitter defined notes on how the age depth model was created. | character |
Site Level
Site information provides important context for your study. You should describe the site and how it fits into your broader study, provide geographic information (although this can be generated automatically from the cores as well), and add any relevant tags and notes regarding site vegetation and inundation. Vegetation and inundation can alternatively be incorporated into the core-level data, whatever makes the most sense for your study design.
| attribute name | definition | data type | format, unit or codes |
|---|---|---|---|
| study_id | Unique identifier for the study made up of the first author’s family name, as well as the second author’s family name or ‘et al.’ if more than three, then publication year separated by underscores. | character | |
| site_id | Site identification code unique to each study. | character | |
| site_description | Site description including relevant study details and political geographic units. Some of these descriptions can be automated by the ingestion code. | character | |
| site_latitude_max | Maximum latitude defining a bounding box for the site in decimal degree World Geodedic System of 1984 (WGS84). This can also be generated automatically by the ingestion code. | numeric | degree |
| site_latitude_min | Minimum latitude defining a bounding box for the site in decimal degree WGS84. This can also be generated automatically by the ingestion code. | numeric | degree |
| site_longitude_max | Maximum longitude defining a bounding box for the site in decimal degree WGS84. This can also be generated automatically by the ingestion code. | numeric | degree |
| site_longitude_min | Minimum longitude defining a bounding box for the site in decimal degree WGS84. This can also be generated automatically by the ingestion code. | numeric | degree |
| site_boundaries | As an alternative to submitting or automatically generating a bounding box, submitters can include a shapefile (.shp) or keyhole markup language (.kml) documenting the geographic boundaries of the site. This can be converted to and stored in well known text (WTK) format. | character | |
| salinity_class | Code based on submitter field observation or measurement indicating average annual salinity (Note: Palustrine and freshwater should only include tidal wetlands, or wetlands that are potentially/formerly tidal but artificially freshened due to artificial tidal restrictions). | factor | estuarine C-CAP = 5-35 parts per thousand salinity (ppt) according to the coastal change analysis program. palustrine C-CAP = < 5 ppt according to the coastal change analysis program. estuarine = 0.5-35 ppt according to most other definitions. palustrine = < 0.5 ppt according to most other definitions. brine = >50 ppt. saline = 30-50 ppt. brackish = 0.5-30 ppt. fresh = <0.5 ppt. mixoeuhaline = 30-40 ppt. polyhaline = 18-30 ppt. mesohaline = 5-18 ppt. oligohaline = 0.5-5 ppt. |
| salinity_method | Indicate whether salinity_class was determined using a field observation or a measurement. | factor | field observation = Salinity inferred by field observation such as vegetation. measurement = Salinity observed from local instrument. |
| salinity_notes | Any relevant submitter generated notes on how salinity_class was determined. | character | |
| vegetation_class | Code based on submitter field observations or measurement indicating dominant wetland vegetation type. | factor | emergent = Describes wetlands dominated by persistent emergent vascular plants. scrub shrub = Describes wetlands dominated by woody vegetation <= 5 meters in height. forested = Describes wetlands dominated by woody vegetation > 5 meters in height. forested to shrub = Dominated by forested to scrub/shrub biomass. forested to emergent = Dominated by forest and underlying marsh. seagrass = Describes tidal or subtidal communities dominated by rooted vascular plants. |
| vegetation_method | Indicate whether vegetation_class was determined using a field observation or a measurement | factor | field observation = Vegetation inferred by field observation. measurement = Vegetation measured by counts or plots. |
| vegetation_notes | Any relevant submitter generated notes on how vegetation_class was were determined | character | |
| inundation_class | Code based on submitter field observation or measurement indicating how often the coring location is inundated | factor | high = Study-specific definition of an elevation relatively high in the tidal frame, typically defined by vegetation type. mid = Study-specific definition of an elevation in the relative middle of the tidal frame, typically defined by vegetation type. low = Study-specific definition of an elevation in relatively low in the tidal frame, typically defined by vegetation type. levee = Study-specific definition of a relatively high elevation zone built up on the edge of a river, creek, or channel. back = Study-specific definition of a relatively low elevation zone behind a levee. |
| inundation_method | Indicate whether inundation_class was determined using a field observation or a measurement | factor | field observation = Inundation inferred by field observation such as vegetation. measurement = Inundation class assessed from elevation and nearby tide gauge or other similar method. |
| inundation_notes | Any relevant submitter generated notes on how inundation was determined | character |
Core Level
Note that positional data can be assigned at the core level, or at the site level. However, it is important that this is specified, that site coordinates are not attributed as core coordinates, and that the method of measurement and precision is noted. Vegetation and inundation can alternatively be incorporated into the site-level data, whatever makes the most sense to your study design. In the future this level of hierarchy will be complemented by a ‘subsite level’ as this level of hierarchy can handle any sublocation information such as vegetation plot, and instrument location/description.
| attribute name | definition | data type | format, unit or codes |
|---|---|---|---|
| study_id |
Unique identifier for the study made up of the first author’s family name, as well as the second author’s family name or ‘et al.’ if more than three, then publication year separated by underscores. |
factor | NA |
| site_id | Site identification code unique to each study. | factor | NA |
| core_id | Core identification code unique to each site. | factor | NA |
| core_date | Date of core collection. | Date | YYYY-MM-DD |
| core_notes | Any other relevant submitter generated notes on how cores were collected. | character | |
| core_latitude | Positional latitude of the core in decimal degree WGS84. | numeric | degree |
| core_longitude | Positional longitude of the core in decimal degree WGS84. | numeric | degree |
| core_position_accuracy | Accuracy of latitude and longitude measurement, if determined and recorded. | numeric | meter |
| core_position_method | Code indicating how latitude and longitude were determined. | factor |
RTK = Real-time kinematic global position system (GPS). handheld = Conventional Commercially available hand-held GPS. other high resolution = Any other technique resulting in positional error < 1 meter. other moderate resolution = Any other technique resulting in positional error < 30 meters. other low resolution = Any other technique resulting in positional error > 30 meters. |
| core_position_notes | Any relevant submitter generated notes on how latitude and longitude were determined. | character | |
| core_elevation | Surface elevation of the core relative to defined datum. | numeric | meters |
| core_elevation_datum | The datum relative to which the core elevation was measured against (For a complete list of datum names and aliases please refer to the ISO Geodedic Registry https://geodetic.isotc211.org/). | factor |
NAVD88 = A gravity-based geodetic datum, North American Vertical Datum of 1988. MSL = A tidal datum, Mean Sea Level as measured against a local tide gauge. MTL = A tidal datum, Mean Tidal Level as measured against a local tide gauge. MHW = A tidal datum, Mean High Water as measured against a local tide gauge. MHHW = A tidal datum, Mean Higher High Water as measured against a local tide gauge. MHHWS = A tidal datum, Mean Higher High Water for Spring Tides as measured against a local tide gauge. MLW = A tidal datum, Mean Low Water as measured against a local tide gauge. MLLW = A tidal datum, Mean Lower Low Water as measured against a local tide gauge. |
| core_elevation_accuracy | Accuracy of elevation measurement, if determined and recorded | numeric | meters |
| core_elevation_method | Code indicating how elevation was determined | factor |
RTK = Real-time kinematic GPS. other high resolution = Any other technique resulting in positional error < 5 cm of random error. LiDAR = Handheld GPS matched to lidar-based digital elevation model. DEM = Handheld GPS matched to another digital elevation model. other low resolution = Any other technique resulting in positional error > 5 cm of random error. |
| core_elevation_notes | Any relevant submitter generated notes on how elevation was determined | character | |
| salinity_class | Code based on submitter field observation or measurement indicating average annual salinity (Note: Palustrine and freshwater should only include tidal wetlands, or wetlands that are potentially/formerly tidal but artificially freshened due to artificial tidal restrictions). | factor |
estuarine C-CAP = 5-35 parts per thousand salinity (ppt) according to the coastal change analysis program. palustrine C-CAP = < 5 ppt according to the coastal change analysis program. estuarine = 0.5-35 ppt according to most other definitions. palustrine = < 0.5 ppt according to most other definitions. brine = >50 ppt. saline = 30-50 ppt. brackish = 0.5-30 ppt. fresh = <0.5 ppt. mixoeuhaline = 30-40 ppt. polyhaline = 18-30 ppt. mesohaline = 5-18 ppt. oligohaline = 0.5-5 ppt. |
| salinity_method | Indicate whether salinity_class was determined using a field observation or a measurement | factor |
field observation = Salinity inferred by field observation such as vegetation. measurement = Salinity observed from local instrument. |
| salinity_notes | Any relevant submitter generated notes on how salinity_class was determined | character | |
| vegetation_class | Code based on submitter field observations or measurement indicating dominant wetland vegetation type. | factor |
emergent = Describes wetlands dominated by persistent emergent vascular plants. scrub shrub = Describes wetlands dominated by woody vegetation < 5 meters in height. forested = Describes wetlands dominated by woody vegetation > 5 meters in height. seagrass = Describes tidal or subtidal communities dominated by rooted vascular plants. |
| vegetation_method | Indicate whether vegetation_class was determined using a field observation or a measurement | factor |
field observation = Vegetation inferred by field observation. measurement = Vegetation measured by counts or plots. |
| vegetation_notes | Any relevant submitter generated notes on how vegetation_class and dominant_species were determined. | character | |
| inundation_class | Code based on submitter field observation or measurement indicating how often the coring location is inundated. | factor |
high = Study-specific definition of an elevation relatively high in the tidal frame, typically defined by vegetation type. mid = Study-specific definition of an elevation in the relative middle of the tidal frame, typically defined by vegetation type. low = Study-specific definition of an elevation in relatively low in the tidal frame, typically defined by vegetation type. levee = Study-specific definition of a relatively high elevation zone built up on the edge of a river, creek, or channel. back = Study-specific definition of a relatively low elevation zone behind a levee. |
| inundation_method | Indicate whether inundation_class was determined using a field observation or a measurement | factor | field observation = Inundation inferred by field observation such as vegetation. measurement = Inundation class assesed from elevation and nearby tidegauge or other similar method. |
| inundation_notes | Any relevant submitter generated notes on how elevation was determined | character | |
| core_length_flag | Indicated whether or not the coring team believes they recovered a full sediment profile, down to bedrock, or other non-marsh interface. | factor | core depth limited by length of corer = The total depth of the core was limited by the length of the coring device. core depth represents deposit depth = Authors report that the depth of the core represents the depth of the wetland soil deposit. not specified = Authors did not specify whether or not the depth of the core represents the depth of the wetland soil deposit. |
Soil Depth Series
This level of hierarchy contains the actual depth series information. At minimum a submission needs to specify minimum and maximum depth increments, dry bulk density, and either fraction organic matter or fraction carbon. Sample ID’s should be used in the case that there are multiple replicates of a measurements. There is plenty of room for recording raw data from various dating techniques as well as age depth models.
| attribute name | definition | data type | format, unit or codes |
|---|---|---|---|
| study_id | Unique identifier for the study made up of the first author’s family name, as well as the second author’s family name or ‘et al.’ if more than three, then publication year separated by underscores. | character | |
| site_id | Site identification code unique to each study | character | |
| core_id | Core identification code unique to each site | character | |
| depth_min | Minimum depth of a sampling increment. | numeric | centimeter |
| depth_max | Maximum depth of a sampling increment. | numeric | centimeter |
| sample_id | Sample identification unique to the core. This should be used in the case that there are relevant lab specific sample codes, or in the case that there are multiple replicate samples. | character | |
| dry_bulk_density | Dry mass per unit volume of a soil sample. This does not include ash free bulk density. | numeric | gramsPerCubicCentimeter |
| fraction_organic_matter | Mass of organic matter relative to sample dry mass. Ash free bulk density should not be used here but should be expressed as a loss on ignition fraction. | numeric | dimensionless |
| fraction_carbon | Mass of carbon relative to sample dry mass. | numeric | dimensionless |
| compaction_fraction | Fraction of the sample depth interval reduced due to compaction. | numeric | dimensionless |
| compaction_notes | Any submitter generated notes on compaction. | character | |
| cs137_activity | Radioactivity counts per unit dry weight for radiocesium (137Cs). | numeric | becquerelPerKilogram |
| cs137_activity_sd | 1 standard deviation of uncertainty associated with cs137_activity. | numeric | becquerelPerKilogram |
| total_pb210_activity | Total radioactivity counts per unit dry weight for excess lead 210 (210Pb). | numeric | becquerelPerKilogram |
| total_pb210_activity_sd | 1 standard deviation of uncertainty associated with total_pb210_activity. | numeric | becquerelPerKilogram |
| ra226_activity | Total radioactivity counts per unit dry weight for Radium 226 (226Ra) if measured as part of the 210Pb dating process. | numeric | becquerelPerKilogram |
| ra226_activity_sd | 1 standard deviation of uncertainty associated with ra226_activity. | numeric | becquerelPerKilogram |
| excess_pb210_activity | Excess radioactivity counts per unit dry weight for excess lead 210 (210Pb). | numeric | becquerelPerKilogram |
| excess_pb210_activity_sd | 1 standard deviation of uncertainty associated with excess_pb210_activity. | numeric | becquerelPerKilogram |
| c14_age | Radiocarbon age as estimated from AMS measurements. | numeric | radiocarbonYear |
| c14_age_sd | Estimated uncertainty in c14_age. | numeric | radiocarbonYear |
| c14_material | Description of the material selected for radiocarbon (14C) dating. | character | |
| c14_notes | Any relevant submitter generated notes on 14C dating process. | character | |
| delta_c13 | The isotopic signature of 13C. This is oftentimes measured along with c14_age and can be useful for analyzing carbon lability and provenance. | numeric | partsPerMillion |
| be7_activity | Radioactivity counts per unit dry weight for 7Be. | numeric | becquerelPerKilogram |
| be7_activity_sd | Estimated uncertainty in be_7_activity. | numeric | becquerelPerKilogram |
| am241_activity | Radioactivity counts per unit dry weight for 241Am. | numeric | becquerelPerKilogram |
| am241_activity_sd | Estimated uncertainty in am_241_activity. | numeric | becquerelPerKilogram |
| marker_date | The age of any other dated depth horizon such as an artificial marker, pollen horizon, pollution horizon, etc. | Date | YYYY-MM-DD |
| marker_type | Code indicating the type of marker. | factor | artificial horizon = Horizon was added to the surface artificially by using materials such as feldspar, glitter, or rare earth elements. pollen = Pollen analysis was used to tie horizon to the timing of vegetation change such as the arrival of invasives, or the beginning of local agriculture. pollution = Chemical analysis was used to tie the horizon to the timing of a pollution event. tsunami = Sediment analysis was used to tie the horizon to the timing of a tsunami event. |
| marker_notes | Any other submitter generated notes about the origin of the marker. | character | |
| age | Most likely, median, or mean age of the depth interval from submitter generated age depth model. | numeric | year |
| age_min | Minimum age of the depth interval from submitter generated age depth model. | numeric | year |
| age_max | Maximum age of the depth interval from submitter generated age depth model. | numeric | year |
| age_sd | Standard deviation of age estimate from submitter generated age depth model. | numeric | year |
| depth_interval_notes | Any other submitter generated notes specific to the depth interval. | character |
Multiple Special Conditions at the Level of the Site or Core
Because there may be multiple observations or conditions that are part of the study, such as species present, or degradation or restoration activities, that can affect a site or core, these are archived separately.
Dominant Species Present
You can record species codes associated with sites and/or cores. The CCRCN is species code system is derived from the USDA PLANTS Database, and for most taxa, the code consists of the first two letters of genus follow by the first two letters of the species (e.g., "Spartina alterniflora" = "SPAL").
| attribute name | definition | data type | format, unit or codes |
|---|---|---|---|
| study_id | Unique identifier for the study made up of the first author’s family name, as well as the second author’s family name or ‘et al.’ if more than three, then publication year separated by underscores. | character | |
| site_id | Site identification code unique to each study. | character | |
| core_id | Core identification code unique to each site. | character | |
| species_code | Code associated with a species or a vegetation assemblage. | character |
Anthropogenic Impacts Present
You can record various codes associated with degradation or restoration conditions at sites and/or cores.
| attribute name | definition | data type | format, unit or codes |
|---|---|---|---|
| study_id | Unique identifier for the study made up of the first author’s family name, as well as the second author’s family name or ‘et al.’ if more than three, then publication year separated by underscores. | character | |
| site_id | Site identification code unique to each study. | character | |
| core_id | Core identification code unique to each site. | character | |
| impact_class | Code indicating any major anthropogenic impacts historically and currently affecting the coring location. | factor | tidally restricted = Tidal flow is muted or blocked by built structures. impounded = Water level is raised artificially by a tidal restriction, resulting in ponding of water on the wetland and or upland surface. managed impounded = Wetland is impounded seasonally, and other times natural or semi natural hydrology occurs. ditched = Tidal hydrology is altered because artificial ditches have been cut to promote tidal flooding and drainage. diked and drained = The wetland has been diked and drained, with or without flapper gates, pumping, or other means. farmed = Managed impoundment or drainage in which wetland has been converted to agricultural land. tidally restored = Tidal flow has been restored by removing an artificial obstruction. revegetated = Wetland vegetation has been reintroduced by replanting on unvegetated surfaces. invasive plants removed = Natural plant communities have been restored by the active removal of invasive plant species. invasive herbivores removed = Tidal wetland vegetation has been managed by the removal of invasive herbivores. sediment added = Elevation has been managed by artificially adding sediment to the site using techniques such as thin layering or sediment diversion. wetlands built = Constructed wetland using sediments such as dredge spoils or other sediment source. |
Submitter Defined Attributes and Definitions
Part of the reason we control these attribute and variable names are so that the dataset does not become unmanageable, and we can deliver products that run cleanly and smoothly to you. However, we know that research is complicated, and not all of the data you want to include can be represented here. As long as it fits within this hierarchy, we allow you to submit user defined attributes.
Study Level Species Table
If species codes or common names are used anywhere in the study, there should be a separate table included defining all names using scientific names. The CCRCN is species code system is derived from the USDA PLANTS Database, and for most taxa, the code consists of the first two letters of genus follow by the first two letters of the species (e.g., "Spartina alterniflora" = "SPAL").
| attribute name | definition | data type | format, unit or codes |
|---|---|---|---|
| study_id | Unique identifier for the study made up of the first author’s family name, as well as the second author’s family name or ‘et al.’ if more than three, then publication year separated by underscores. | character | |
| species_code | Code associated with a species or a vegetation assemblage. | character | |
| genus | Genus according to the most up to date classification. | character | |
| species | Species according to the most up to date classification. | character | |
| sub_species | Any nomenclature referring to subspecies special cases. | character | |
| hybrid | Any nomenclature referring to special cases of hybridization. | character | |
| common_name | Common name associated with the species, especially if it is referred to in any accompanying text. | character | |
| species_notes | Any other submitter defined notes regarding the species. | character |
Other Attributes and Variables
Any submitter-defined attributes should be included in a separate table indicating the associated level of hierarchy, attribute name, data type (date, factor, character, or numeric). Attribute names should follow good naming practices: self-descriptive, don’t start with a number or special character, no spaces. Dates should be stored as a character string and should have an accompanying ‘string format’ indicating the position, number of digits and deliminators for the date time. For example June twenty-sixth two-thousand eighteen written as 2018-06-26 would be formatted as ‘YYYY-MM-DD’. Here is a handy dateTime reference. Numeric values should have their units defined. Factors (i.e. categorical variables) should be defined in a separate table.
| level of hierarchy | attribute name | description | data Type | format, unit |
|---|---|---|---|---|
| ex. site level or core level | (your column name here. [use good naming conventions]) | (describe your attribute here.) | Date, factor, character, or numeric | (extra necessary info here) |
Variable names, like attribute names, should be self-descriptive. Such as ‘experimental’ or ‘control’ as opposed to ‘1’ and ‘2’.
| level of hierarchy | attribute name | categorical variable name | description |
|---|---|---|---|
| ex. site level or core level | (parent column name here) | (your variable name here.) | (describe your variable) |
That’s It
You now know everything there is to know about soil carbon data management.
Methane Chamber Database Structure
Methane Database Structure 
Naming Conventions for Attributes and Variables
24 April 2020
Overview
This page serves as guidance for the types and scope of data and metadata that will be archived as part of the Coastal Carbon Network’s developing methane chamber data synthesis. We propose the following data structure and standardized attribute names for metadata and data in order to make datasets machine-readable and interoperable. Each subheading lists a level of metadata or data hierarchy from site level to chamber level to timeseries information. Each subheading also represents separate tables which can be joined by common attributes such as study_id, site_id, and chamber_id. We also include accompanying sets of recommended controlled vocabulary for key categorical variables (also known as factors). Some attributes have controlled units that we wish to keep uniform across datasets.
Throughout the table key attributes are bolded. Please strive to provide data for these attributes whenever possible.
Site Level
Site information provides important context for your study. You should describe the site and how it fits into your broader study, provide geographic information, and add any relevant tags and notes regarding site vegetation and inundation.
| attribute_name | definition | unit, format, or codes |
|---|---|---|
| study_id | Unique identifier for the study made up of the first author's family name, as well as the second author's or 'et al' if more than three, then publication year seperated by underscores. | |
| site_id | Site identification code unique to each study. | |
| site_description | Site description including relevant study details and political geographic units. Some of these descriptions can be automated by the ingestion code. | |
| utc_offset | Offset from UTC of site data | hour |
| site_longitude | Positional longitude of the site in decimal degree WGS84. | degree |
| site_latitude | Positional latitude of the site in decimal degree WGS84. | degree |
| site_elevation | Site elevation relative to defined datum. | meter |
| site_elevation_datum | The datum relative to which the site elevation was measured against (For a complete list of datum names and aliases please refer to the ISO Geodedic Registry). | |
| site_elevation_MSL | Elevation of mean sea level relative to a given datum | meter |
| site_elevation_MSL_datum | The datum relative to which the mean sea level was measured against (For a complete list of datum names and aliases please refer to the ISO Geodedic Registry). | |
| site_elevation_MSL_station | Station used to determine MSL | free text |
| site_elevation_MSL_years | Period used to determine MSL | year |
| site_tidal_range | Mean tidal range calculated as the difference between Mean High Water and Mean Low water | meter |
| climate_classification | Köppen climate classification | Af; Am; Aw; Bsh; Bsk; Bwh; Bwk; Cfa; Cfb; Cfc; Csa; Csb; Cwa; Cwb; Cwc; Dfa; Dfb; Dfc; Dfd; Dsa; Dsb; Dsc; Dsd; Dwa; Dwb; Dwc; Dwd; EF; ET |
| land_cover_type_IGBP | Vegetation type based on the IGBP definition | Barren Sparse Vegetation; Croplands; Closed Shrublands; Cropland/Natural Vegetation Mosaics; Deciduous Broadleaf Forests; Deciduous Needleleaf Forests; Evergreen Broadleaf Forests; Evergreen Needleleaf Forests; Grasslands; Mixed Forests; Open Shrublands; Savannas; Snow and Ice; Urban and Built-Up Lands; Water Bodies; Permanent Wetlands; Woody Savannas |
| mean_annual_temp | Climatological long-term Mean Annual average air Temperature (MAT) | degreesCelsius |
| mean_annual_precipitation | Climatological long-term Mean Annual average Precipitation (MAP) | millimeter |
| salinity_class | Code based on submitter field observation or measurement indicating average annual salinity (Note: freshwater should only include tidal wetlands, or wetlands that are potentially/formerly tidal but artificially freshened due to artificial tidal restrictions). | fresh = <0.5 ppt.; oligohaline = 0.5-5 ppt.; mesohaline = 5-18 ppt.; polyhaline = 18-30 ppt.; mixoeuhaline = 30-40 ppt.; saline = 30-50 ppt.; brine = >50 ppt. |
| salinity_method | Indicate whether salinity_class was determined using a field observation or a measurement. | field observation = Salinity inferred by field observation such as vegetation.; measurement = Salinity observed from local instrument. |
| salinity_notes | Any relevant submitter generated notes on how salinity_class was determined. | |
| inundation_class | Code based on submitter field observation or measurement indicating how often the site location is inundated. | high = Study-Specific definition of an elevation relatively high in the tidal frame located above the Mean Highwater Mark (MHW), inundated infrequently either during high rainfall events, spring tides, or above normal high tides and typically defined by vegetation type (e.g., Spartina patens, Distichlis spicata, Salicornia sp., Juncus sp., and bulrush species).; mid = Study-specific definition of an elevation in the relative middle of the tidal frame, typically defined by vegetation type (e.g., Spartina patens).; low = Specific definition of an elevation relatively low in the tidal frame, typically defined by vegetation type (e.g., Spartina alterniflora).; levee = Study-specific definition of a relatively high elevation zone built up on the edge of a river, creek, or channel.; back = Study-specific definition of a relatively low elevation zone behind a levee. |
| inundation_method | Indicate whether inundation_class was determined using a field observation or a measurement | field observation = Inundation inferred by field observation such as vegetation.; measurement = Inundation class assessed from elevation and nearby tide gauge or other similar method. |
| inundation_time | Fraction of time the site location is inundated daily | fraction |
| inundation_notes | Any relevant submitter generated notes on how inundation/elevation was determined | |
| wetland_vegetation_class | Code based on submitter field observations or measurement indicating dominant wetland vegetation type. | mudflat = Describes unvegetated areas exposed and flooded by the tides.; emergent = Describes wetlands dominated by persistent emergent vascular plants.; scrub shrub = Describes wetlands dominated by woody vegetation less than or equal to 5 meters in height.; forested = Describes wetlands dominated by woody vegetation > 5 meters in height.; FO/SS = Dominated by forested to scrub/shrub biomass.; seagrass = Describes tidal or subtidal communities dominated by rooted vascular plants. |
| wetland_vegetation_method | Indicate whether wetland_vegetation_class was determined using a field observation or a measurement | field observation = Vegetation inferred by field observation.; measurement = Vegetation measured by counts or plots. |
| wetland_vegetation_notes | Any relevant submitter generated notes on how vegetation_class was were determined | |
| net_primary_productivity | Annual Net Primary Productivity measured at the site level. Negative values to indicate net uptake | gramsCarbonPerSquareMeterPerYear |
| ecosystem_respiration | Annual ecosystem respiration measured at the site level | gramsCarbonPerSquareMeterPerYear |
| impact_class | Code indicating any major anthropogenic and/or natural impacts historically and currently affecting the site dates of measurement. | undisturbed = No disturbance or management has occurred on the site.; tidally restricted = Tidal flow is muted or blocked by built structures.; impounded = Water level is raised artificially by a tidal restriction, resulting in ponding of water on the wetland and or upland surface.; managed impounded = Wetland is impounded seasonally, and other times natural or semi natural hydrology occurs.; ditched = Tidal hydrology is altered because artificial ditches have been cut to promote tidal flooding and drainage.; diked and drained = The wetland has been diked and drained, with or without flapper gates, pumping, or other means.; farmed = Managed impoundment or drainage in which wetland has been converted to agricultural land.; tidally restored = Tidal flow has been restored by removing an artificial obstruction.; submergence-salinization = due to sea level rise and salt water intrusion.; revegetated = Wetland vegetation has been reintroduced by replanting on unvegetated surfaces.; invasive plants removed = Natural plant communities have been restored by the active removal of invasive plant species.; invasive herbivores removed = Tidal wetland vegetation has been managed by the removal of invasive herbivores.; sediment added = Elevation has been managed by artificially adding sediment to the site using techniques such as thin layering or sediment diversion.; wetlands built = Constructed wetland using sediments such as dredge spoils or other sediment source.; fire = wildfire or managed burns.; land cover change = land use and land cover change.; invasion = woody or urban encroachment.; grazing = herbivory or browsing by mammals, managed or wild.; pests and disease = plant or soil damage from pests, insects, pathogens, blight, and other diseases.; storm or wind = Major storms including unusually high-precipitation and unusually high-wind events e.g. hurricane, hail, flooding from storm, etc. Temperature extreme + heat wave or freeze |
| ecosystem_age | If historically disturbed, time since disturbance | years |
| mean_dry_bulk_density | Mean soil bulk density | gramsPerCubicCentimeter |
| se_dry_bulk_density | Standard error of the mean bulk density | gramsPerCubicCentimeter |
| mean_soil_organic | Mean Soil organic matter conent | fraction |
| se_soil_organic | Standard error of mean soil organic matter conent | fraction |
| mean_soil_carbon | Mean soil organic carbon conent | fraction |
| se_soil_carbon | Standard error of mean soil organic carbon conent | fraction |
| mean_soil_total_nitrogen | Mean soil total nitrogen conent | fraction |
| se_soil_total_nitrogen | Standard error of mean soil total nitrogen conent | fraction |
| mean_soil_total_phosphorous | Mean soil total phosphorous conent | fraction |
| se_soil_total_phosphorous | Standard error of mean soil total phosphorous conent | fraction |
| mean_soil_CN_ratio | Mean soil C:N | dimensionless |
| se_soil_CN_ratio | Standard error of mean soil C:N | dimensionless |
| mean_soil_clay | Mean fraction of clay (<4 microns) in soil (0-1) | fraction |
| se_soil_clay | Standard error of mean fraction of clay | fraction |
| mean_soil_silt | Mean fraction of silt (4 - 63 microns) in soil (0-1) | fraction |
| se_soil_silt | Standard error mean fraction of silt | fraction |
| mean_soil_sand | Mean fraction of sand (>63 microns) in soil (0-1) | fraction |
| se_soil_sand | Standard error of mean fraction of sand | fraction |
Chamber Level
| attribute_name | definition | unit, format, or codes |
|---|---|---|
| study_id | Unique identifier for the study made up of the first author's family name, as well as the second author's or 'et al' if more than three, then publication year seperated by underscores. | |
| site_id | Site identification code unique to each study. | |
| chamber_id | Chamber identification code unique to each site. | |
| chamber_year | Year of chamber installation | YYYY |
| chamber_type | Chamber type | static; automated |
| collar_installation_date | Date of chamber collar installation. | YYYY-MM-DD |
| collar_installation_period | Code indicating how far in advance collars were installed, if collar installation date is unknown. | less than one week prior to sampling event; between one week and one month prior to sampling event; between one month and one year prior to sampling event; more than one year prior to sampling event |
| collar_insertion_depth | Depth of collar insertion | centimeter |
| chamber_volume | Chamber volume. | cubicMeter |
| chamber_area | Collar area. | squareMeter |
| chamber_opacity | chamber opacity | clear; opaque |
| mixing_fan_present | Chamber mixing fan present and operating | TRUE; FALSE |
| path_to_chamber | Was there a boardwalk or other means to approach the chamber without compressing the soil? | TRUE; FALSE |
| chamber_location_notes | chamber location comment (hummock/hollow, wetland edge, ditch, etc) | free text |
| chamber_notes | Any other relevant submitter generated notes on chambers. | |
| chamber_longitude | Positional longitude of the chamber in decimal degree WGS84. | degree |
| chamber_latitude | Positional latitude of the chamber in decimal degree WGS84. | degree |
| chamber_position_accuracy | Accuracy of latitude and longitude measurement, if determined and recorded. | meter |
| chamber_position_method | Code indicating how latitude and longitude were determined. | RTK; handheld; other high resolution; other moderate resolution; other low resolution |
| chamber_elevation | Surface elevation of the chamber relative to defined datum. | meter |
| chamber_elevation_datum | The datum relative to which the chamber elevation was measured against (For a complete list of datum names and aliases please refer to the ISO Geodedic Registry). | |
| chamber_elevation_accuracy | Accuracy of elevation measurement, if determined and recorded | meter |
| chamber_elevation_method | Code indicating how elevation was determined | RTK; other high resolution; LiDAR; DEM; other low resolution |
| chamber_elevation_MSL | Surface elevation of the chamber relative to mean sea level | meter |
| chamber_elevation_notes | Any relevant submitter generated notes on how elevation was determined | |
| salinity_class | If salinity was determined at the site level, please leave it blank here. Code based on submitter field observation or measurement indicating average annual salinity (Note: freshwater should only include tidal wetlands, or wetlands that are potentially/formerly tidal but artificially freshened due to artificial tidal restrictions). | fresh = <0.5 ppt.; oligohaline = 0.5-5 ppt.; mesohaline = 5-18 ppt.; polyhaline = 18-30 ppt.; mixoeuhaline = 30-40 ppt.; saline = 30-50 ppt.; brine = >50 ppt. |
| salinity_method | Indicate whether salinity_class was determined using a field observation or a measurement | field observation = Salinity inferred by field observation such as vegetation.; measurement = Salinity observed from local instrument. |
| salinity_notes | Any relevant submitter generated notes on how salinity_class was determined | |
| inundation_class | If inundation was determined at the site level, please leave it blank here. Code based on submitter field observation or measurement indicating how often the chamber location is inundated. | high = Study-Specific definition of an elevation relatively high in the tidal frame located above the Mean Highwater Mark (MHW), inundated infrequently either during high rainfall events, spring tides, or above normal high tides and typically defined by vegetation type (e.g., Spartina patens, Distichlis spicata, Salicornia sp., Juncus sp., and bulrush species).; mid = Study-specific definition of an elevation in the relative middle of the tidal frame, typically defined by vegetation type (e.g., Spartina patens).; low = Specific definition of an elevation relatively low in the tidal frame, typically defined by vegetation type (e.g., Spartina alterniflora).; levee = Study-specific definition of a relatively high elevation zone built up on the edge of a river, creek, or channel.; back = Study-specific definition of a relatively low elevation zone behind a levee. |
| inundation_method | Indicate whether inundation_class was determined using a field observation or a measurement | field observation = Inundation inferred by field observation such as vegetation.; measurement = Inundation class assessed from elevation and nearby tide gauge or other similar method. |
| inundation_time | Fraction of time the chamber location is inundated daily | fraction |
| inundation_notes | Any relevant submitter generated notes on how inundation/elevation was determined | |
| wetland_vegetation_class | If wetland veg class was determined at the site level, please leave it blank here. Code based on submitter field observations or measurement indicating dominant wetland vegetation type. | mudflat = Describes unvegetated areas exposed and flooded by the tides.; emergent = Describes wetlands dominated by persistent emergent vascular plants.; scrub shrub = Describes wetlands dominated by woody vegetation less than or equal to 5 meters in height.; forested = Describes wetlands dominated by woody vegetation > 5 meters in height.; FO/SS = Dominated by forested to scrub/shrub biomass.; seagrass = Describes tidal or subtidal communities dominated by rooted vascular plants. |
| wetland_vegetation_method | Indicate whether vegetation_class was determined using a field observation or a measurement | field observation = Vegetation inferred by field observation.; measurement = Vegetation measured by counts or plots. |
| wetland_vegetation_notes | Any relevant submitter generated notes on how vegetation_class and dominant_species were determined. | |
| field_or_manipulation_code | Code to indicate whether this is a field study or an artificial growing manipulation like a marsh organ or mesocosm. | field; marsh organ; mesocosm |
| chamber_treatment_code | Code indicating whether there was an experimental treatment at the plot (as opposed to an unmanipulated control). | control; treatment |
| chamber_treatment_notes | Any relevant submitter generated notes on how chamber_treatment_code was determined. | |
| chamber_species | Species (Latin binomial) according to the most up to date classification. If multiple species per chamber, separate species name by semicolons | |
| chamber_species_date | Measurement date of species fraction cover, biomass, leaf area, LAI or height | YYYY-MM-DD |
| fraction_cover | Estimated ground area coverage of species or vegetation type in chamber (0-1). If multiple species per chamber, separate each species cover by semicolons following the same order as the chamber_species | fraction |
| fraction_cover_method | Method used to calculate fraction cover | number; mass; area; abundance |
| clipping | Was vegetation clipped before measurement period? | TRUE; FALSE |
| biomass | Live plant mass within chamber footprint. If multiple species per chamber, separate each species biomass by semicolons following the same order as the chamber_species | gC/m2 |
| specific_leaf_area | Specific leaf area of plants in chamber | squareCentimetersPerGram |
| leaf_area_index | Leaf area index of plants in chamber | m2/m2 |
| species_CN_ratio | carbon/nitrogen ratio in vegetation in chamber or representative of chamber | dimensionless |
| height | average plant height within chamber | meter |
| species_notes | Any other submitter defined notes regarding the species. | |
| dry_bulk_density | Soil bulk density | gramsPerCubicCentimeter |
| soil_organic | Soil organic matter conent | fraction |
| soil_carbon | Soil organic carbon conent | fraction |
| soil_CN_ratio | Soil C:N | dimensionless |
Chamber Time Series
This level of hierarchy contains the actual time series information. Sample ID’s should be used in the case that there are multiple replicates of a measurements.
| attribute_name | definition | unit, format, or codes |
|---|---|---|
| study_id | Unique identifier for the study made up of the first author's family name, as well as the second author's or 'et al' if more than three, then publication year seperated by underscores. | |
| site_id | Site identification code unique to each study. | |
| chamber_id | Chamber identification code unique to each site. Use chamber_id followed by a position and aggregation qualifiers H_V_R (horizontal_ vertical_replicate). For example two replicate chambers (Ch_1_1_1 and Ch_1_1_2), two different chambers in the same site (Ch_1_1_1 and Ch_2_1_1) | |
| sample_id | Unique identifier for samples if there are more than one replicate per sampling event. | |
| sample_year | Year of the sampling event. | YYYY |
| sample_month | Month of the sampling event. | MM |
| sample_day | Day of the sampling event. If DD was not recorded, use NA | DD |
| chamber_eq_time | Length of time the chamber equilibrated before measurements were taken. | minutes |
| chamber_measurement_length | Measurement length | minutes |
| chamber_volume | Chamber volume. | cubicMeter |
| sample_start_time_hour | Start of measurement period, local time, no DST. | HH |
| sample_start_time_minutes | Start of measurement period, local time, no DST. | MM |
| sample_start_time_seconds | Start of measurement period, local time, no DST. If seconds were not recorded use NA | SS |
| sample_end_time_hour | End of measurement period, local time, no DST | HH |
| sample_end_time_minutes | End of measurement period, local time, no DST | MM |
| sample_end_time_seconds | End of measurement period, local time, no DST. Use NA if seconds were not recorded | SS |
| chamber_measurement_mode | Measurement mode | Close flow, open flow or point measurement |
| chamber_flow_rate | Chamber flow rate | L min-1 |
| light_treatment | Fraction (0-1) describing any light/dark treatment the sampling event was subjected too. | Fraction ambient light (0 is dark) |
| ch4_analyzer | model of analyzer(s) used for fluxes | free text |
| ch4_flux | Methane flux (CH4) inside chamber. Positive fluxes are net emissions to atmosphere. | nanoMolPersquareMeterPerSecond |
| ch4_flux_model | Specify model/method used to calculate flux over sampling period. | linear; exponential ; summation of fluxes during specific time intervals; internal vs external gas concentration |
| ch4_flux_se | The standard error of CH4 flux. | |
| ch4_flux_n | Typical number of sampling events within sampling period. | |
| ch4_flux_r2 | The R^2 value of the model used to calculate flux over sampling period. | dimensionless |
| ch4_flux_pvalue_threshold | p-value threshold of significance of the slope parameter | |
| ch4_flux_notes | Any user submitted notes about CH4 during the sampling period. | |
| co2_flux | Carbon dioxide (CO2) flux inside chamber. Positive fluxes are net emissions to atmosphere. | microMolPersquareMeterPerSecond |
| co2_flux_model | Specify model used to calculate flux over sampling period. | linear; exponential ; summation of fluxes during specific time intervals; internal vs external gas concentration |
| co2_flux_se | The standard error of CO2 flux. | |
| co2_flux_n | Number of sampling events within sampling period. It is valid to report a typical number for continuous measurements | |
| co2_flux_r2 | The R^2 value of the model used to calculate flux over sampling period. | dimensionless |
| co2_flux_notes | Any user submitted notes about CO2 during the sampling period. | |
| n2o_flux | The flux of N2O between the chamber and environment over the sampling period. | nanoMolPersquareMeterPerSecond |
| n2o_flux_model | Specify model used to calcuate flux over sampling period. | linear; exponential ; summation of fluxes during specific time intervals; internal vs external gas concentration |
| n2o_flux_se | The standard error of N2O flux. | |
| n2o_flux_n | Typical number of sampling events within sampling period. | |
| n2o_flux_r2 | The R^2 value of the model used to calculate flux over sampling period. | dimensionless |
| n2o_flux_notes | Any user submitted notes about N2O during the sampling period. | |
| air_temperature_inside_chamber | Air temperature inside chamber measured over the sampling time. | degreesCelsius |
| air_temperature_outside_chamber | Air temperature outside chamber measured over the sampling time. | degreesCelsius |
| soil_temperature | Soil temperature inside chamber measured over the sampling time. | degreesCelsius |
| soil_temperature_depth | Soil temperature probe depth. | centimeter |
| soil_water_content | Soil water content (volumetric) inside chamber, range 0-100 | Percent |
| soil_water_content_depth | Soil depth at which water content/maisture has been measured | centimeter |
| par_inside_chamber | Photosynthetically active raditation, incoming, inside the chamber | micromolPhotonPerSquareMeterPerSecond |
| par_outside_chamber | Photosynthetically active raditation, incoming, outside the chamber | micromolPhotonPerSquareMeterPerSecond |
| conductivity | Temperature corrected electrical conductivity (EC) | milliSiemensPerMeter |
| salinity | Salinity measured during the sampling interval | ppt |
| conductivity_salinity_media | Indicate whether conductivity and salinity where measured in surface, porewaters or bulk soil. | surface; porewater; soil |
| conductivity_salinity_depth | Conductivity and salinity probe depth. Negative values indicate depths below soil surface. | centimeter |
| water_table_depth | water table depth (negative values belowground surface) | meter |
| sampling_interval_notes | Any other relevant user submitted notes. | free text |
Porewater Level
| attribute_name | definition | unit, format, or codes |
|---|---|---|
| study_id | Unique identifier for the study made up of the first author's family name, as well as the second author's or 'et al' if more than three, then publication year seperated by underscores. | |
| site_id | Site identification code unique to each study. | |
| chamber_id | Chamber identification code unique to each site. | |
| sample_id | Unique identifier for samples if there are more than one replicate per sampling event. | |
| porewater_method | Method used to collect porewater samples | sippers; peepers; piezometer; centrifugation; core |
| sample_year | Year of the sampling event. | YYYY |
| sample_month | Month of the sampling event. | MM |
| sample_day | Day of sampling event. If day was not recorded please use NA | DD |
| sample_start_time | Start of measurement period, local time, no DST | HH:mm:ss |
| sample_end_time | End of measurement period, local time, no DST | HH:mm:ss |
| porewater_depth | Depth of the porewater draw | centimeter |
| porewater_depth_min | If porewaters integrate several centimeters, min (upper) depth of the porewater draw | centimeter |
| porewater_depth_max | If porewaters integrate several centimeters, maximum (bottom) depth of the porewater draw | centimeter |
| porewater_temperature | Temperature of porewaters at chamber or site location | degreesCelcious |
| porewater_conductivity | Porewater conductivity at chamber or site location | milliSiemens |
| porewater_conductivity_depth | Depth of the porewater draw | centimeter |
| porewater_salinity | Salinity measured in porewater at chamber or site location | partsPerThousand |
| porewater_salinity_depth | Porewater salinity probe depth | centimeter |
| porewater_pH | soil porewater pH | numeric |
| porewater_O2_concentration | Dissolved oxygen measured in porewater at sampling time. | microMolar |
| porewater_SO4_concentration | Sulfate measured in porewater at sampling time. | milliMolar |
| porewater_H2S_concentration | Sulfide measured in porewater at sampling time. | microMolar |
| porewater_FeIII_concentration | Ferric iron measured in porewater at sampling time. | microMolar |
| porewater_FeII_concentration | Ferrous iron measured in porewater at sampling time | microMolar |
| porewater_NH4+ | Ammonium measured in porewater at sampling time | microMolar |
| porewater_NO3+NO2 | Nitrate-Nitrite measured in porewater at sampling time | microMolar |
| porewater_CH4_concentration | Methane measured in porewater at sampling time. | microMolar |
| porewater_DOC_concentration | Dissolved organic carbon measured in porewater at sampling time | microMolar |
| porewater_DIC_concentration | Dissolved inorganic carbon measured in porewater at sampling time | microMolar |
Reports and Publications
Publications by the Coastal Carbon Community
Arias‐Ortiz, A., Wolfe, J., Bridgham, S. D., Knox, S., McNicol, G., Needelman, B. A., ... & Holmquist, J. R. (2024). Methane fluxes in tidal marshes of the conterminous United States. Global Change Biology, 30(9), e17462.
Holmquist, J. R., Klinges, D., Lonneman, M., Wolfe, J., Boyd, B., Eagle, M., ... & Megonigal, J. P. (2024). The Coastal Carbon Library and Atlas: Open source soil data and tools supporting blue carbon research and policy. Global Change Biology, 30(1), e17098.
Maxwell, T. L., Rovai, A. S., Adame, M. F., Adams, J. B., Álvarez-Rogel, J., Austin, W. E., ... & Worthington, T. A. (2023). Global dataset of soil organic carbon in tidal marshes. Scientific data, 10(1), 797.
Malhotra, A., Todd-Brown, K., Nave, L. E., Batjes, N. H., Holmquist, J. R., Hoyt, A. M., ... & Vindušková, O. (2019). The landscape of soil carbon data: emerging questions, synergies and databases. Progress in Physical Geography: Earth and Environment, 43(5), 707-719.
Rogers, K., Kelleway, J. J., Saintilan, N., Megonigal, J. P., Adams, J. B., Holmquist, J. R., ... & Woodroffe, C. D. (2019). Wetland carbon storage controlled by millennial-scale variation in relative sea-level rise.
Holmquist, J. R., Windham-Myers, L., Bernal, B., Byrd, K. B., Crooks, S., Gonneea, M. E., ... & Megonigal, J. P. (2018). Uncertainty in United States coastal wetland greenhouse gas inventorying. Environmental Research Letters, 13(11), 115005.
Holmquist, J. R., Windham-Myers, L., Bliss, N., Crooks, S., Morris, J. T., Megonigal, J. P., ... & Ferner, M. C. (2018). Accuracy and precision of tidal wetland soil carbon mapping in the conterminous United States. Scientific reports, 8(1), 9478.
Reports and Publications
Coastal Carbon Network Reports
The Coastal Carbon Network (CCN) produces regular reports on the state of available blue carbon data. These are available for download below.
Community Resources

CCN: Data Curation in R
This is a series of exercises to work on R tidyverse using CCRCN data. Learn to import, display, manipulate, and plot data with a set of human- and machine-readable commands.
Make EML with R and share on GitHub
This tutorial, courtesy of Colin Smith of EDI, introduces use of an R package that will facilitate the process of creating and organizing your metadata in EML format as a XML file. Unfamiliar with these acronyms? Give this a glance.
Data Carpentries Lessons
Data Carpentry aims to teach fundamental concepts, skills and tools for working more effectively with data. Much of the content that the CCRCN teaches is derived from the Data Carpentries suite of lessons.
RStudio Cheat Sheets
Why memorize syntax? This isn't a Chem 101 exam. Feel free to use a cheat sheet to remind you of the right commands-- RStudio has developed lots of helpful ones.
Predictive Soil Mapping with R
A great resource for geospatial processing in R catered towards pedalogists and geologists, derived from community efforts and responsive to new input.
Coastal Wetlands Methodologies and Protocols
Provided below is a set of guides and documentation relevant to the field and laboratory methods of wetlands research. Have suggestions of other resources to include here? Email us at CoastalCarbon@si.edu.
Overview of Surface Elevation Tables
This website presents information on the purpose, design, and use of the SET.
NAPT Regional Soil Testing/Analysis Methods
Learn more about region-specific methods for processing inland and coastal soil samples.
ISCN Soil Science Resources Page
The International Soil Carbon Network (ISCN) has conglomerated a list of analysis labs, protocols, and collaborators to assist the community.
Blue Carbon Manual
Manual for measuring, assessing, and analyzing coastal blue carbon.
Coastal Carbon Protocols
Protocols for conducting carbon stock assessments and submitting data to the Coastal Carbon Atlas. Available in English, Spanish, and French.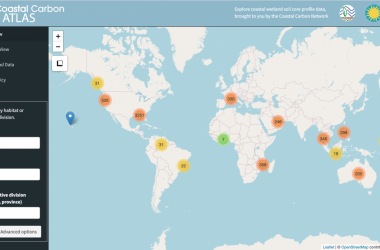
Users Guide to the Coastal Carbon Atlas
Tutorial for exploring, querying, and downloading data from the Coastal Carbon Atlas.
Guía de Usuario para el Coastal Carbon Atlas
Tutorial para explorar, consultar, y descargar datos del Coastal Carbon Atlas.
Carbon Data Visualizations Across the Globe
From colleagues within the Smithsonian and beyond, here are a handful of interesting map products worth a visit.

Coastal Carbon Atlas
Use this map to visualize, query, and download data from the CCN Data Library.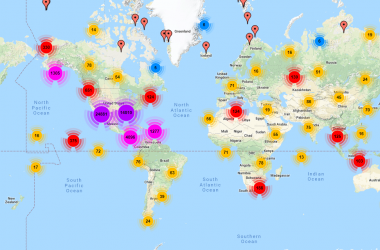
ISCN Data Access Map
The International Soil Carbon Network offers one of the most expansive databases on soil carbon stock and flux, which can be accessed through this map interface. Please familiarize yourself with the Data Information page before use. Note: users need to create an account to access this page.
Global Mangrove Soil Organic Carbon
Spatial predictions of soil carbon stocks under mangrove forests of the world. Product of Sanderman et al. 2018, Environmental Research Letters
Global Carbon Atlas
An online platform to explore, visualize and interpret global and regional carbon data arising from both human activities and natural processes, hosted by the Global Carbon Project.
ForC Database Map
The Forest C database (ForC-db) is an open access global carbon database led by Dr. Kristina Anderson-Teixeira of the Smithsonian. It currently contains >17,500 records from >2,700 plots and >2,000 sites, making it the largest and most comprehensive database of its type.One of the primary goals of the CCN is to provide training tools and tutorials for coastal carbon researchers. Here is a listing of the training products developed by the Network to date.
Collaborative Coding for Carbon Science
The CCN aspires to make coding a more enjoyable and collaborative process for all. We conform to tidyverse philosophies and grammar, which provides a unified methodology to approach R coding. Take a look at some of these tools and training developed by CCN managers as well as other developers from across the web.
Principles and Governance
Principles and Governance
The goal of the Coastal Carbon Network (CCN) is to accelerate the pace of discovery in coastal wetland carbon science by providing our community with access to data, analysis tools, and synthesis opportunities. Our activities include bringing data libraries online, creating open source analysis and modeling tools, providing training and outreach opportunities, holding town halls, responding to community feedback, and hosting data synthesis workshops targeted at strategically reducing uncertainty in coastal carbon science issues. Our first focal activity is building a public online data library of soil carbon data.
The Coastal Carbon Network (herein Network) builds on work by the Blue Carbon Initiative, the NASA Blue Carbon Monitoring System, and the US Carbon Cycle Science Program. Our data management principles incorporate experience from these efforts, and best practices developed in collaboration with data management specialists across the Smithsonian and our partner institutions.
Core Principles
- We are responsive to a global community of scientists and practitioners.
- We focus on quantifiable improvements to the state of the science.
- We adopt protocols, policies, and communication platforms that facilitate transparency, ease of adoption, program sustainability, and data stability.
Defined Roles and Responsibilities within the CCN
- Principle Investigators (PI) - PI's are responsible for executing the project as proposed in its supporting grants, reporting to funders on project progress, and carrying out the fiduciary requirements of each grant.
- Director - The Director is responsible for directing the activities of the Principal Investigators, and overall management of the Network.
- Manager - The Manager is hired by the Director with input from the steering committee. The manager is responsible for leading the daily activities of the Network, responding to stakeholders, and interacting with the Steering Committee.
- Steering Committee Members - Steering committee members are responsible for advising the Director and Manager on Network management, adherence to core principles, workshop topics, and evaluating steering committee nominees.
- CCN Personnel - Principal Investigators, the Steering Committee, and people with official Smithsonian affiliations who work on Network-related tasks. Personnel are responsible for implementing the activities of the Network.
- Collaborators / Collaborating Organizations - Collaborators include researchers who are not Network personnel, but are otherwise actively contributing to Network products in collaboration with Network personnel, or as part of data synthesis workshops. Collaborators are expected to participate at the level of co-author on synthesis products. Collaborating Organization responsibilities are similar to Collaborators except the organization and the Network have entered into a memorandum of understanding to formalize expectations with respect to the Network. Collaborating organizations are encouraged to explore opportunities to secure funding to support Network activities, which are entirely grant funded.
- Partners / Partner Organizations - Include anyone engaged in any Network activities, but more informally than Collaborators. These include remote consultations, town halls, Twitter, webinars, online surveys, and participating in public comment periods. The best way to be recognized as a partner is to sign up for regular Network email updates. Partner Organizations include any organizations that interact with the Network in a manner similar to Partners, but have entered into a memorandum of understanding with the Network that formalizes activities such as consultation or other non-monetary support for Network goals.
- Users - Anyone using data structures or synthesis products created by the Network. There is no obligation to involve Network personnel or collaborators in individual research efforts beyond the topical working groups. Users are responsible for properly citing Network synthesis products, and properly citing original authors when datasets curated or synthesized by the Network are downloaded and reused. See the Data Use Policy.
Steering Committee Membership
The three Principal Investigators are permanent members of the Steering Committee. Five additional members will be chosen to assist the Network with existing or emerging needs as identified by the Steering Committee. In principle, the members should represent a range of stakeholder interests and technical expertise. Members serve for one year, but can be reappointed for one year at the discretion of the Director. Candidates for the steering committee can nominate themselves or be nominated by their colleagues. The steering committee will vote on replacements, and members stepping down will help to choose their own replacement. Rotations are staggered so that no more than half of the rotating members on the Steering Committee are replaced in a given year.
Working Groups
Data synthesis products assembled and maintained by the Network will be developed in topical working groups organized and led by Network personnel and collaborators. Working group topics and their participants are designated by the Steering Committee. These groups emphasize the sharing of data and expertise, and leverage this collaboration to create products which advance coastal wetland carbon science.
Coauthorship Policy
Those accepted to participate in any of the five synthesis workshops hosted by the Network will be expected to contribute before, during, and following the workshop, and will be granted co-authorship on publications resulting from the effort. We will follow the American Geophysical Union’s 2017 Scientific and Professional Ethics: Guideline B. Ethical Obligations of Authors/Contributors for determining co-authorship. Submitting data to the network alone will not merit co-authorship in data syntheses. If done according to the protocols established herein, it will result in citation.
Co-authorship policies in data sharing exercises often benefit established researchers from western industrialized nations at the expense of those from groups with less institutional power 1. We commit to adopting policies and technologies that facilitate engagement of students, people with indigenous knowledge, and researchers from low and middle income countries as attendees and co-authors in synthesis activities.
Data Use Policy
We refer to users as anyone using either data we curate, or synthesis products we create. Data that is curated, but not created, by the Network, should not be attributed to the Network. Users should cite all dataset DOIs and credit the datasets’ original authors. All synthesis products created by the Network and associated collaborators will be listed under a Creative Commons With Attribution license. The Network should be acknowledged and cited appropriately if users utilize any of the data structures, tools, or scripts developed by Network and associated collaborators. We will develop additional tools to assist users in generating lists of citations, but users will be ultimately responsible for correctly citing all data used.
-
Serwadda D, Ndebele P, Grabowski MK, Bajunirwe F, Wanyenze RK (2018). Open data sharing and the Global South: Who benefits?. Science, 359(6376), 642-643.https://doi.org/10.1126/science.aap8395↩︎
Submit Data / Join the Network
Data Submission and Joining the Network
Submit Your Data to the Coastal Carbon Data Library and Atlas
We welcome contributions of carbon data from coastal wetland habitats that experience tidal influence (or are anticipated to in the future). We accept data that is published or unpublished as long as the original measurements are available. If you are interested in contributing data, please email CoastalCarbon@si.edu and CCN personnel will assist you in the process. We also encourage you to log your submission in our Coastal Carbon Data Discovery form. This will submit an entry to our Data Discovery catalog, which helps us inventory and queue datasets for inclusion in the Coastal Carbon Atlas.
Data sharing is a fundamental part of the Coastal Carbon Network’s (CCN) goal to increase data discovery and access in coastal wetland carbon science. Our Network serves as a global convener of coastal blue carbon data, and we seek to make sure that the information which we are serving reflects the scope and investment of the research community. Our Network data sharing activities are based on trust, and it is important that we maintain the provenance of every dataset and provide credit to every researcher who produced it.
Why submit data to the Coastal Carbon Network?
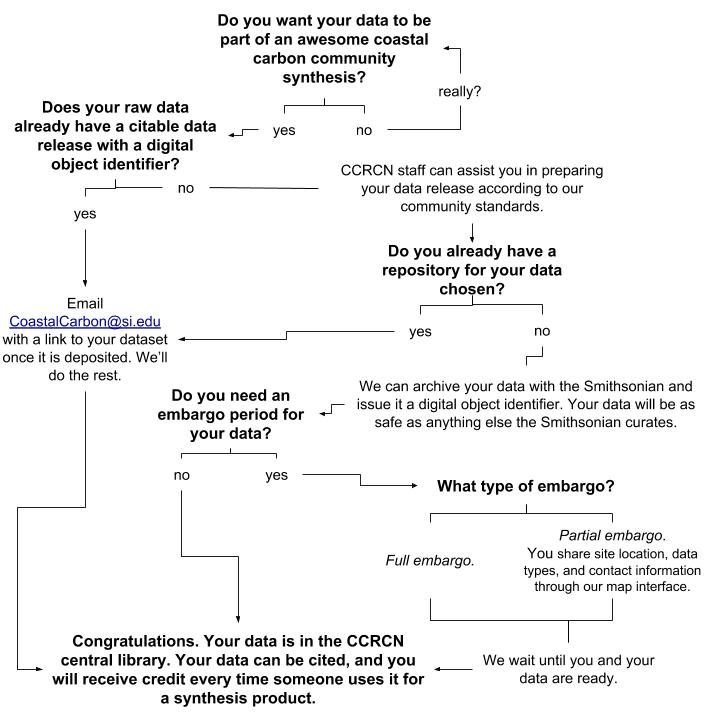
1. It will increase the likelihood that your data will be included in future syntheses and analyses. This means more citations, more collaborations, and more publicity of your work. We can also advertise your data to the community through the Coastal Carbon Atlas. This will also make your data directly accessible for projects and assessments at the state, region, and international scale, as we have detailed in our recent data inventory report.
2. The CCN is nested under the Smithsonian, a trusted institution with a legacy of long-term archival. The Smithsonian has a long history of archiving physical and digital content, as well as high visibility and recognition. Submitting data to the CCN will enable you to release your dataset as a distinct digital object identifier (DOI), which can be embargoed and versioned, and is stored under one of the Smithsonian Library's digital repositories (the default is Figshare).
3. Our data clearinghouse is targeted to serve the coastal carbon community and receptive to feedback. Because our focus is specialized, as opposed to a more general data repository, our vocabulary and structure is catered to those engaged in coastal carbon science, and we have the capability to quickly respond to new developments and recommendations through our version-controlled data structure.
4. We have full-time staff dedicated to assisting the data carpentry and archival process. Our staff are happy to assist the process of curating and publishing your data by assembling a data release that is complete with study metadata, affiliated licensing, and a reserved DOI.
5. You decide when and how the data are released to the public. By establishing an embargo on a data submission, we can ensure that the data are not made public before a certain date, or until you have published with them. Although our default data repository is the research-orientated Figshare, we are able to assist with data releases that will be deposited in other locations, such as a data bank designated by your funding sources.
Interested in contributing data to the CCN? If so, please email CoastalCarbon@si.edu and our team will assist you in the process. Data submissions can remain embargoed for a time specified by the submitter. In embargo cases a data release will be prepared and shared with the submitter via a private link. When a data release is made public, the dataset is drawn into synthesis products.
Please use our Data Submission templates, which can then be emailed to CoastalCarbon@si.edu.
Stay Up to Date with the Coastal Carbon Network
Frequent Updates
Follow @coastalcarbon on Twitter
Monthly Updates
Internship Opportunity
SERC Fall Internship Opportunity: Mapping Restoration Opportunities for Managed Coastal Wetlands
Application Period Ends: August 30
Stipend: $550 / week for 10 weeks
The Smithsonian Environmental Research Center (SERC) Biogeochemistry Lab is searching for an intern to assist in a coastal wetland restoration mapping project. We are looking for a candidate with experience and training in coding and data management and experience in contributing to environmental science research projects. Importantly we are seeking someone who learns quickly, loves to solve problems, has a passion for conservation science, and is a good collaborator.
During their experience the successful candidate will have the opportunity to learn advanced coding, GIS and Remote Sensing skills, will contribute towards building open-source research products, will be introduced to an extensive network of collaborators and stakeholders, and will learn a lot about the science and policy surrounding our coastal wetlands.
Candidates should have
- Upper division class credit completed in Biology, Geography, or Environmental Science, or a related discipline.
- Passed a course in quantitative statistics, or demonstrated equivalent experience.
- The ability to code in R or Python, or a similar language.
- Enough applied coding, GIS, or Remote Sensing experience to be able to design and troubleshoot multi-step workflows.
- Some skills in data visualization.
This internship will start in October 2019 and continue for 10 weeks. Women and members of underrepresented communities are strongly encouraged to apply. To apply, please send a curriculum vitae, a personal essay, and contact information for two references to James Holmquist [HolmquistJ@si.edu] and cc’ Alison Cawood [CawoodA@si.edu]. In your essay describe your interest in environmental studies, why you are interested in interning at the Smithsonian, and any relevant background experience. You may also use this section to describe your future career goals and how a SERC internship will help you. Essays should be no longer than 2 single-spaced pages. We look forward to hearing from you!
Information about the Smithsonian Environmental Research Center:
SERC is focused on understanding the causes and consequences of environmental change for marine, freshwater, and terrestrial ecosystems. The main campus is a 2,650-acre research site on the shores of the Chesapeake Bay in Edgewater Maryland. Facilities include the Global Change Research Wetland, the site of the known longest running ecological manipulation experiment. SERC is located about 10 miles south of Annapolis, MD. We recommend interns bring a vehicle for personal transportation, if possible. There is on-site dormitory space available for $105.00 per week. SERC does not supply board, but the dorms are equipped with full kitchens.
