Bluebird Monitoring
About the Project
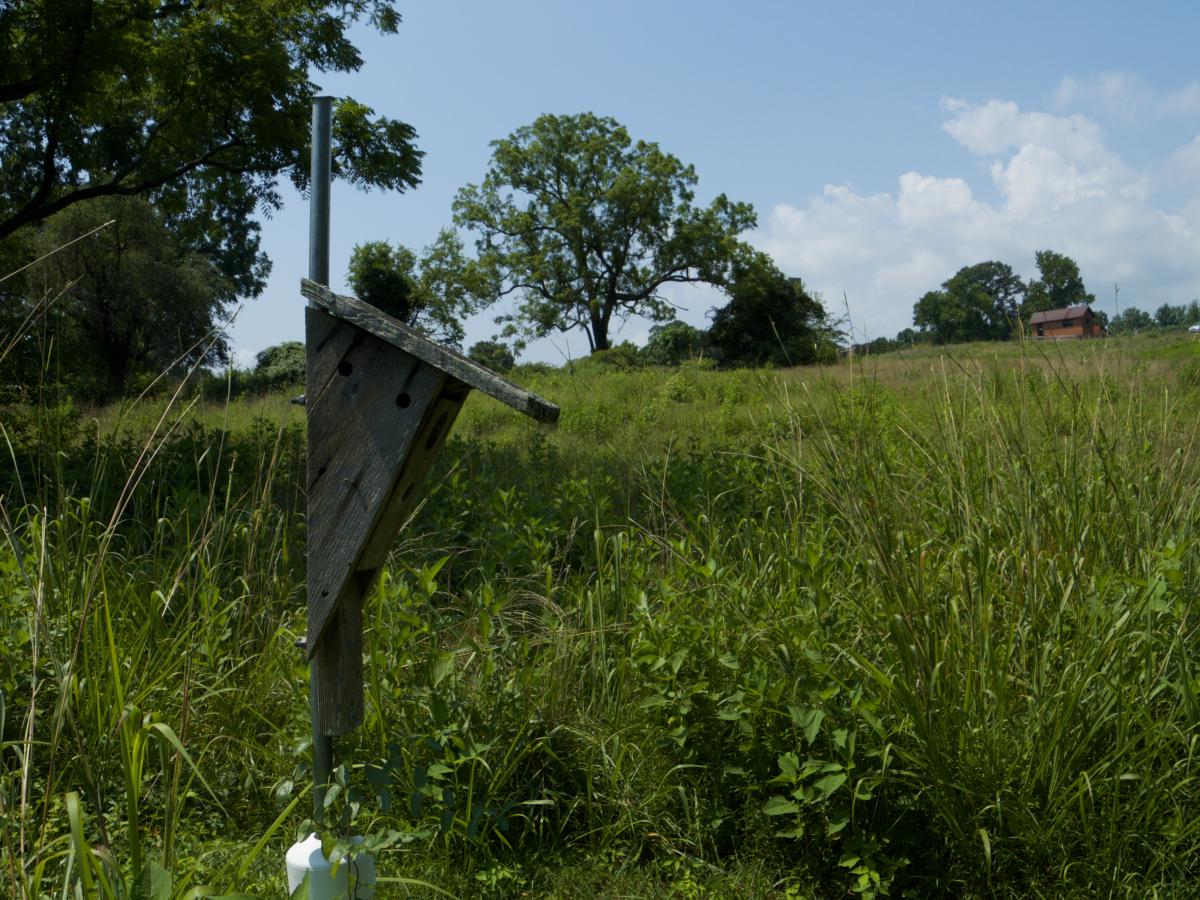
Volunteers walk portions of SERC’s bluebird trail once a week and collect data from our 48 nest boxes. Several different species of cavity-nesting birds call our boxes “home”, including Eastern Bluebirds, Carolina Chickadees and Tree Swallows. By looking at the nests and eggs inside the boxes, volunteers determine who is living there, and for how long. This data is then analyzed to find population patterns.
History of Bluebird Boxes
Bluebirds have long been a symbol of happiness, good health, and hope. For hundreds of years, humans have used nest boxes to facilitate cavity-nesting bird populations such as bluebirds and martins, which brought good luck and reliable food sources through their eggs. However, their value goes beyond symbolism and into the realm of insect control, as nest boxes are used on farms and orchards to protect crops.
As a result of climate and land use changes, Eastern Bluebird populations reached record lows in the late 1960’s. These cavity-nesting birds lost much of their habitat as forests were cut for expanding communities and agricultural purposes. In 1978, the North American Bluebird Society was founded to promote the recovery of Bluebirds and other cavity nesters. Since then, volunteers have been designing and developing bluebird boxes and trails. Bluebird boxes and trails have popped up all over the United States, including SERC’s 2,650 acre campus.
SERC’s bluebird trail, consisting of 48 bluebird boxes, is monitored by volunteers to document bird activity as the world around us continues to change. For over ten years, SERC’s bluebird trail has been providing essential habitat for Eastern Bluebirds.
The "What" and the "Why"
What are we trying to learn?
We want to understand patterns in the bird populations and what causes them. How are the local bird populations reacting to environmental changes in weather and land use? We know that there was a decline in their populations in the late 1960's, but we don't know why. Tracking bluebird populations as well as their reactions to changes in weather, land use can help us understand what affects the species.
Why do we care about bluebirds? Who cares if they disappear?
Bluebirds have a large historical and cultural significance in the Eastern United States. They continue to play an important role in protecting crops from insects, ensuring a reliable food source for people. Farmers plant bluebird boxes around agricultural fields to feed on insects that can otherwise destroy crops.
Methods
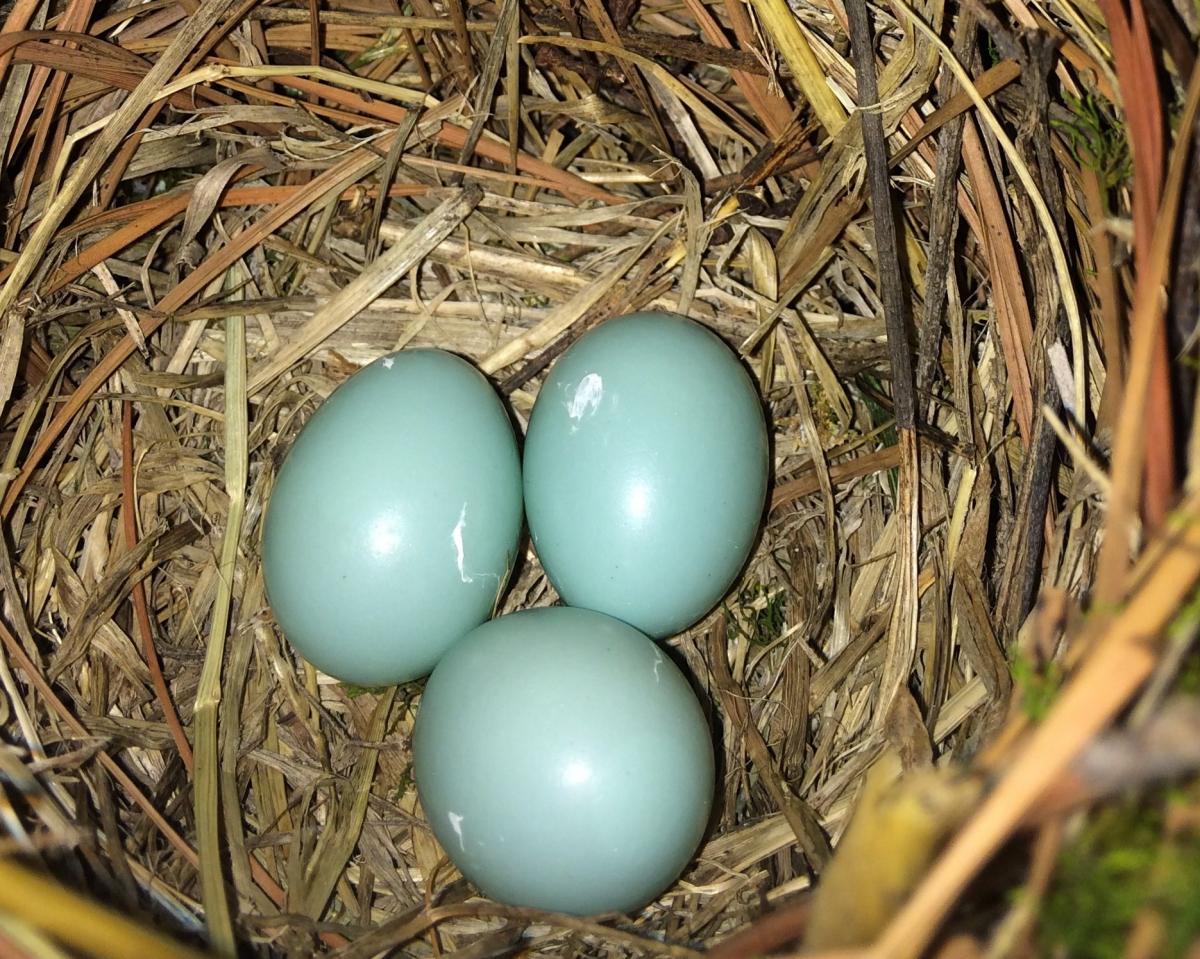
Nestboxes can be found all over SERC’s campus, around farm fields, by the forest’s edge, and in small gardens. Once a week, volunteers carefully check each of 48 boxes to see who’s been living there. We don’t want to scare birds by sneaking up on their nests, so we knock on the side of the boxes first to allow mothers to fly away. When the box is opened, volunteers take note of what they find, from nests to eggs to insects that are living in the boxes. Different birds can be identified by the materials that the nests are made of and the color of the eggs.
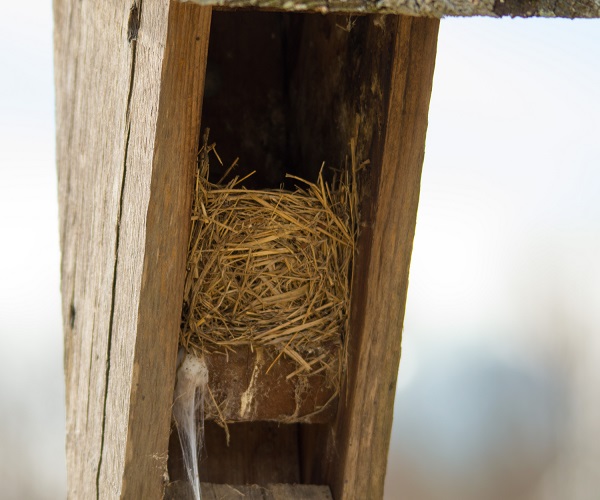

Chickadee nests are made of green plant material, like moss, while bluebirds create nests from dried grasses. Bluebird eggs are usually sky blue, and in rare cases they are white. Chickadee eggs are white and speckled. Sometimes, an overabundance of insects, such as ants or wasps, can make a nestbox an undesirable home for our birds, so volunteers safely remove what they can. It would take a long time for one person to monitor the whole trail each week, so data collection is typically split among 2-3 people.
Data
Data has been collected from the nestboxes since 2008, and has been analyzed since summer 2015. All of the data collected at each nestbox is time stamped, so we can look at the development of nests and eggs over time. This data is also plotted against temperature data from SERC’s own meteorological tower. Harsh, cold winters may be causing a drop in bird populations, particularly when the temperature is below freezing for more than a week straight.


Get Involved
*We are not currently accepting new volunteers*
With multiple volunteers, it’s easy for us to collect data from each nest box every week. Otherwise, it would take one person over three hours to collect the same data! The bluebird trail can be divided into as many sections as we have volunteers to help lighten the load.
Eligibility and time commitment
The minimum age to participate in this project is 16. You must be able to monitor nest boxes at SERC once a week. This project is highly independent, and we recommend that you monitor with a friend. This project is volunteer-directed and run, so there are no specific dates or times for data collection.
To get more information
Contact Rachael Mady, SERC Participatory Science Coordinator, at MadyR@si.edu or 443-482-2276